
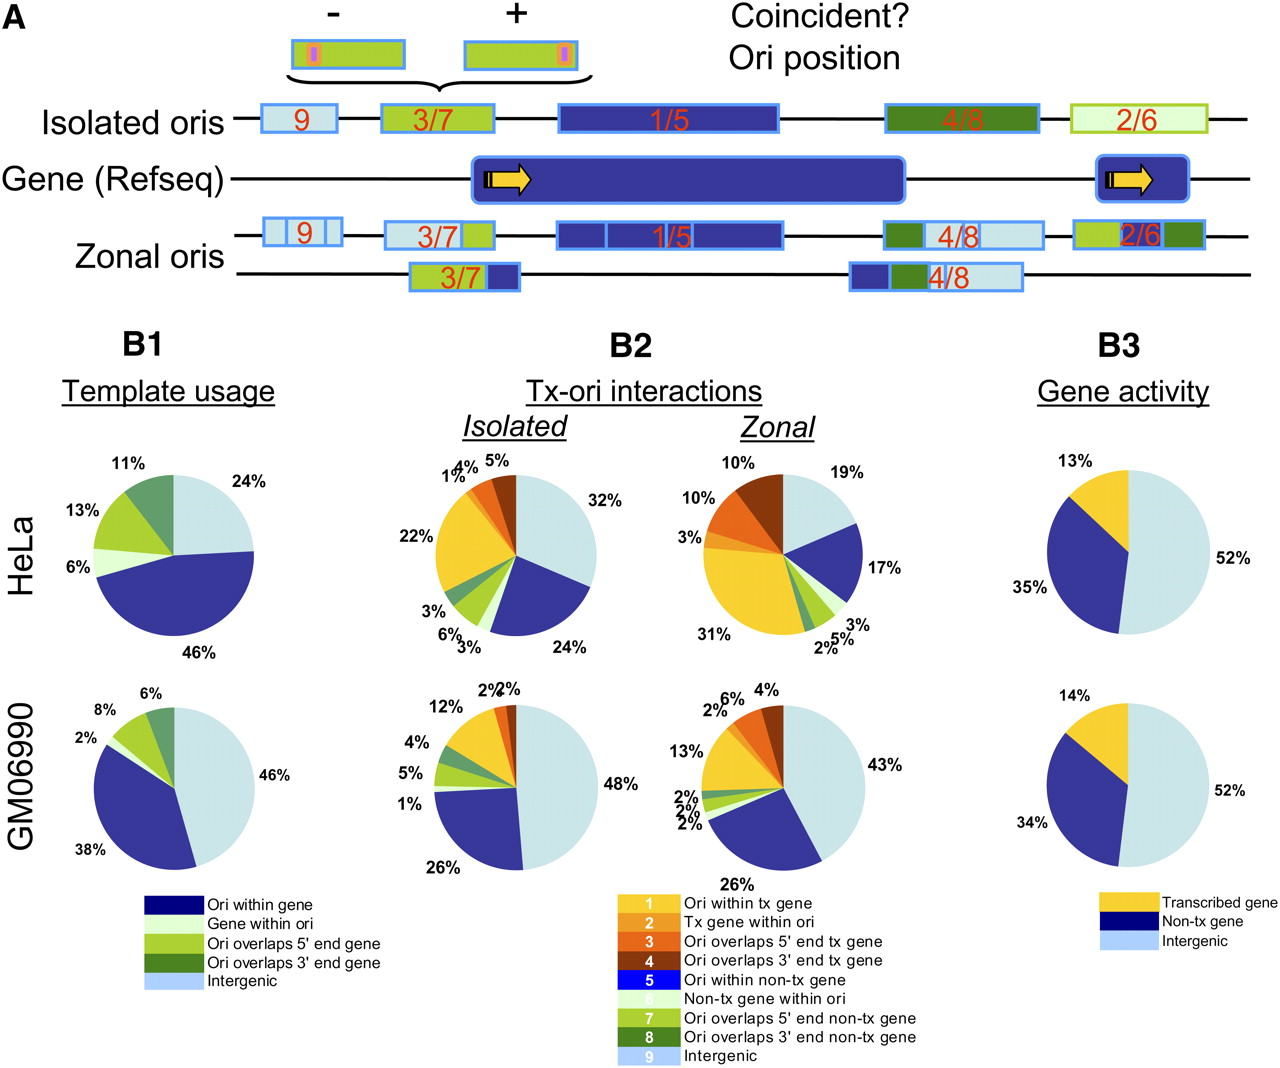
Origin–gene interactions are markedly different between isolated and clustered fragments, and between HeLa and GM06990 cells. (A) The black lines represent the DNA template with genes (Refseqs) and bubble-containing fragments, whether isolated or clustered, indicated as rounded or square boxes, respectively, on the axis. Origin fragments are colored either light-blue (intergenic), dark-blue (genic), or light or dark-green (overlapping indeterminate). The yellow arrow indicates the direction of transcription. The box numbers correspond to the nine categories summarized in the text, below B2, and in Table 1. The two green boxes at the top illustrate the ambiguity associated with a fragment that only partly overlaps a gene, since the transcribed part might not overlap the part that initiates replication. (B1) Origin distributions relative to DNA template sequences, where the light-blue sector is intergenic, dark-blue is genic, and the three different green sectors represent categories 6–8, which overlap genes (indicated by key below). (B2) Distribution of isolated or clustered bubble-containing fragments among intergenic (light-blue), completely nontranscribed genic (dark-blue), partially overlapping nontranscribed genic (three green sectors), or completely or partially overlapping transcribed genomic regions (yellow-to-orange sectors; see key below). (B3) Percentages of the HeLa and GM06990 genomes that are intergenic (light-blue), nontranscribed genic (dark-blue), or transcribed (yellow; see key below).


