
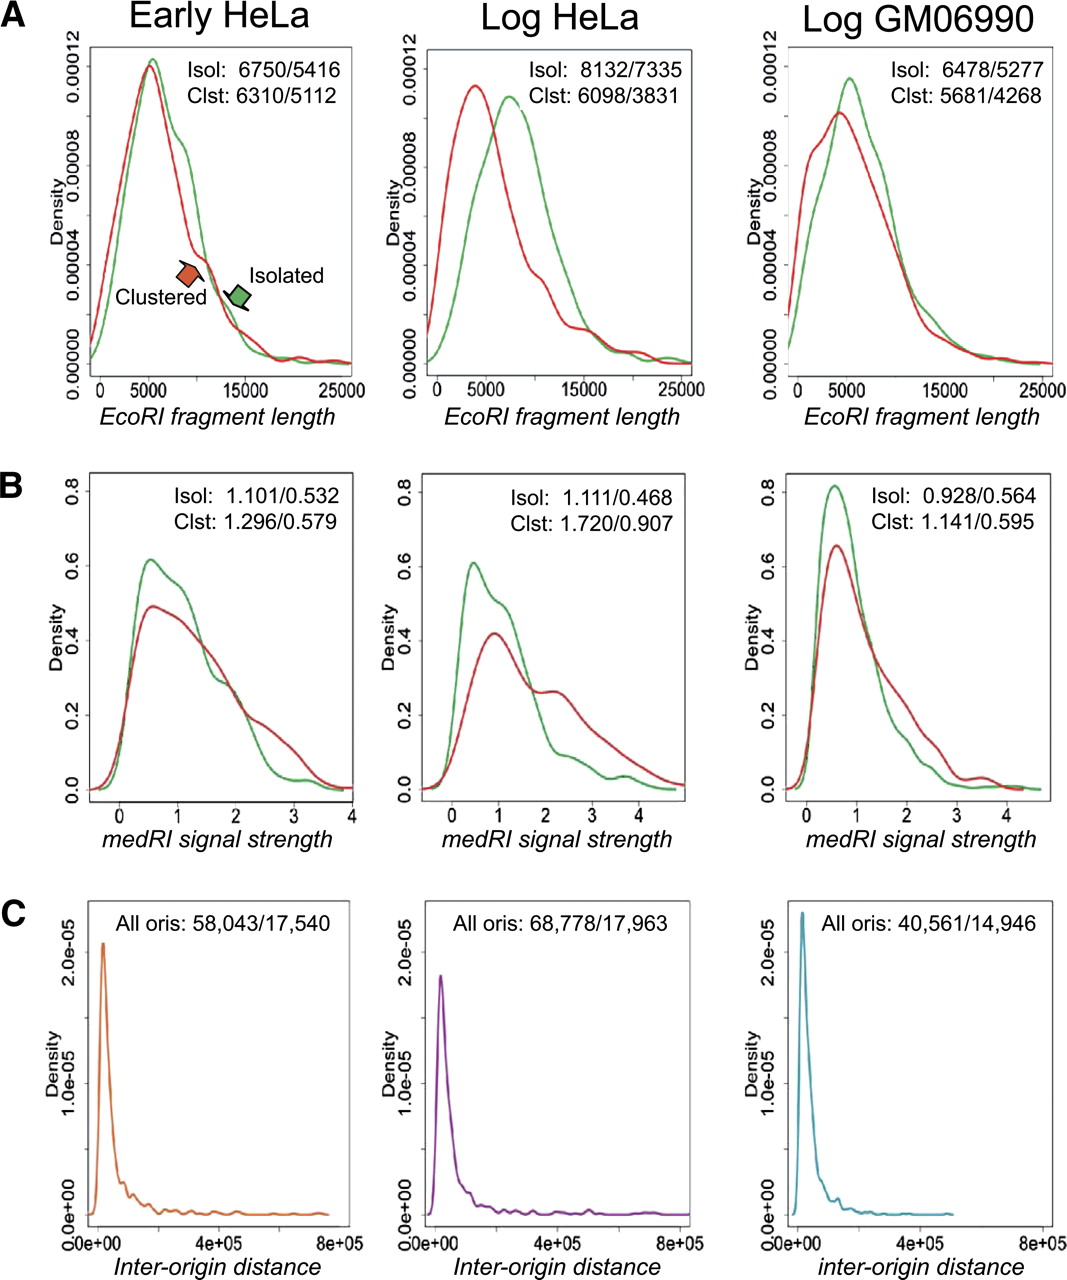
Figure 4.
Fragment sizes, signal strengths, and inter-origin distances in the three libraries. (A,B) The distributions of fragment lengths and signal strengths for isolated (green) and clustered (red) fragments are plotted for the three libraries, in which density corresponds to normalized counts or frequency (where the area under the curve equals 1) in A, B, and C, respectively. The mean and modal values for each distribution are indicated in the upper right corner of each panel. (C) The interorigin distance distributions for the three libraries, with means and modes shown within each panel.


