
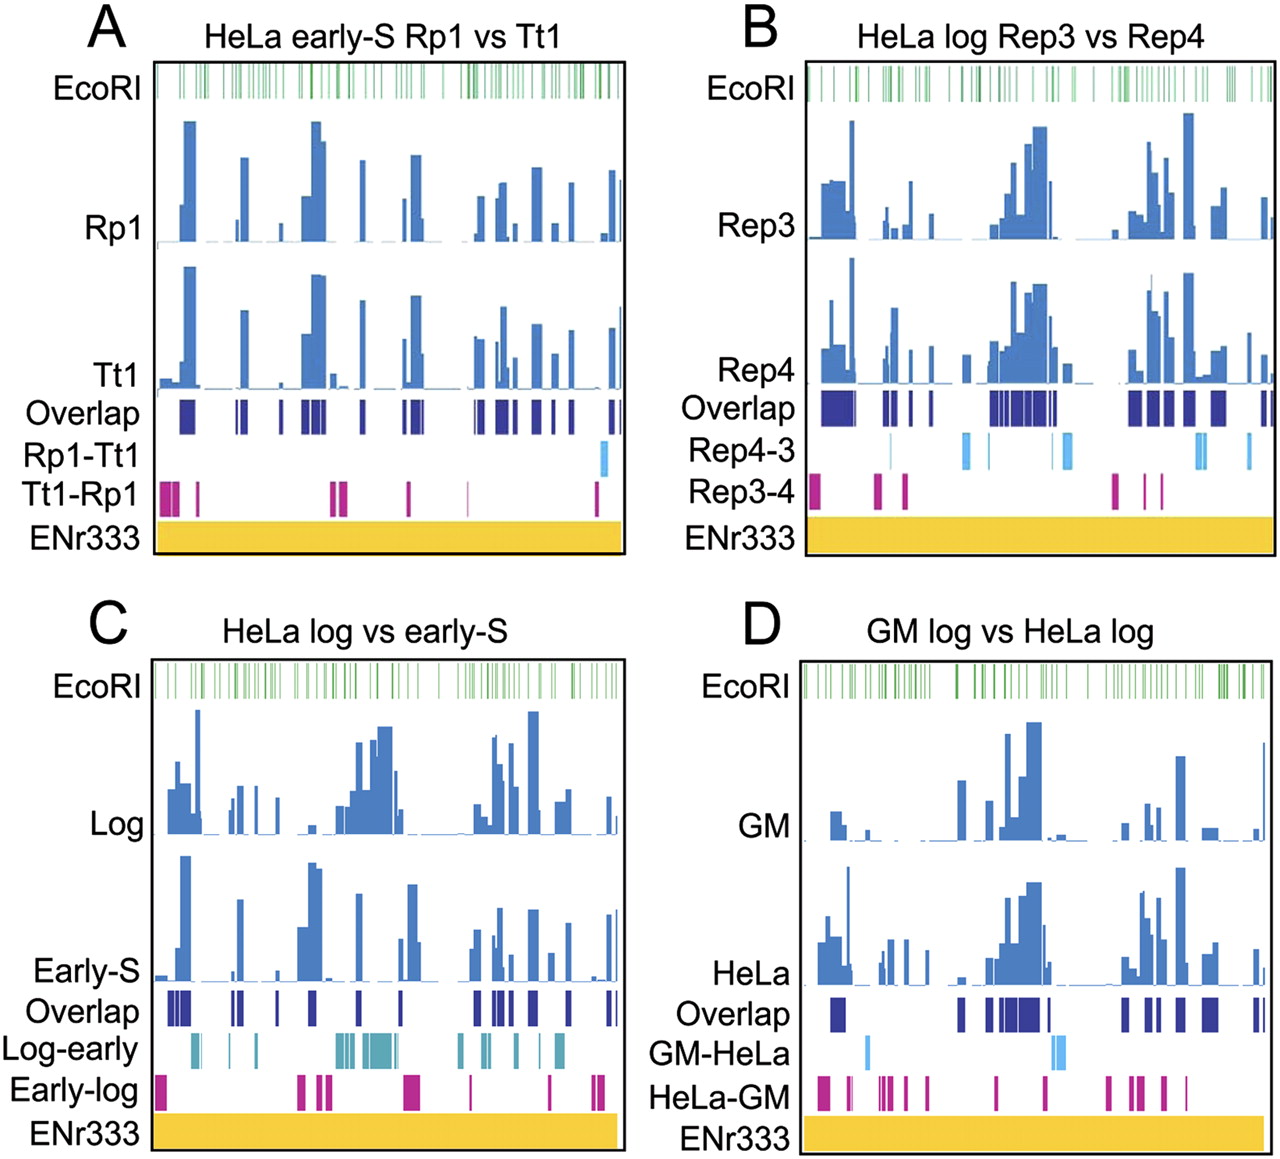
MedRI origin maps reveal bubble fragment clustering, effects of cell synchronization, and major differences in origin distribution between GM06990 and HeLa cells. Four different medRI comparisons are shown for ENr333 in the second and third rows of each panel, with the fourth row indicating overlaps, and fifth and sixth rows representing the nonoverlapping fragments. The notation X–Y indicates fragments in sample X that were not detected in sample Y. Note also that the signals in the last three rows are proportional to the width of each EcoRI fragment, but not the signal strengths. (A) Comparison of Rp1 and Tt1 hybridizations with the early S-phase HeLa library. (B) Comparison of Rep3 and Rep4 biological replicate log-phase HeLa libraries. (C) Comparison of log-phase and early S-phase HeLa libraries. (D) Comparison of log-phase HeLa and GM06990 origin libraries.


