
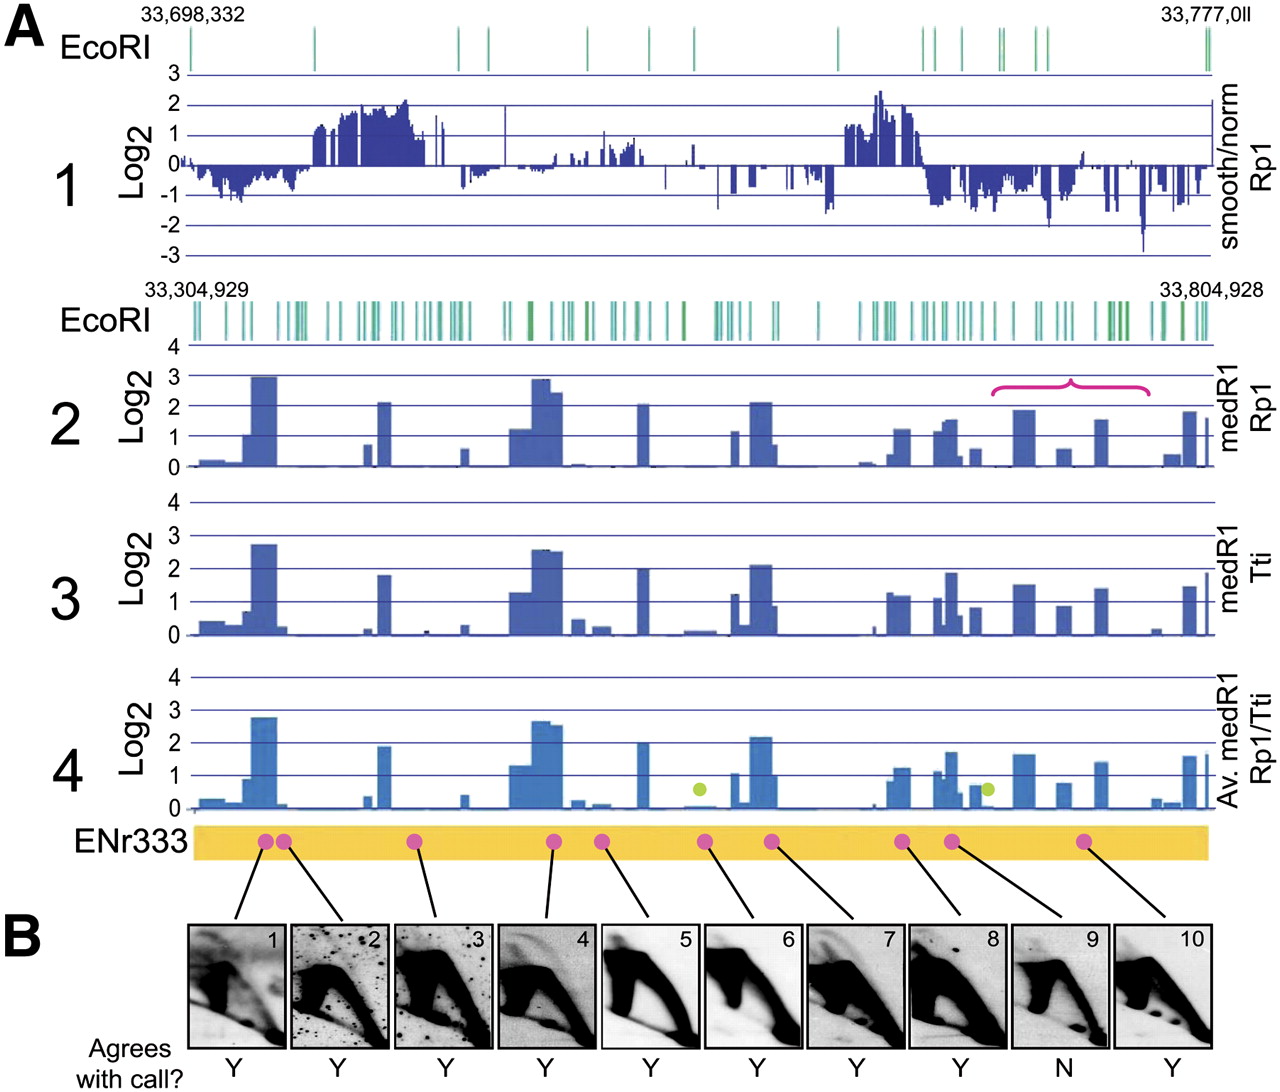
Microarray hybridizations are reproducible and paint a reliable picture of origin distributions in the genome. (A) Early S-phase HeLa microarray data at different stages of analysis. (A1) Zoomed-in view of normalized, smoothed, log2 ratios of bubble fragments over genomic control from the Rp1 hybridization for a 78-kb region in Enr333 (33,698,3332–33,777,011), which illustrates details of the array signals and their strict tracking with individual EcoRI fragments (EcoRI sites shown in green at the top). (A2) Log2 median signals (zero cut-off) within EcoRI fragments (medRI) from the Rp1 hybridization for the entire 500-kb Enr333 region (33,304,929–33,804,928), showing the EcoRI sites at the top; the location of the expanded region in A1 is indicated with the red bracket. (A3) MedRI data for the Tt1 hybridization. (A4) Averaged medRI values of Rp1 and Tt1 replicates; the green dots indicate calls that would not survive the 0.2 cut-off value. (B) The corresponding genomic fragments for selected positive and negative fragments from panel A4 were analyzed on 2D gels, with the Y and N below the images indicating whether the 2D gel result concords with the microarray call.


