
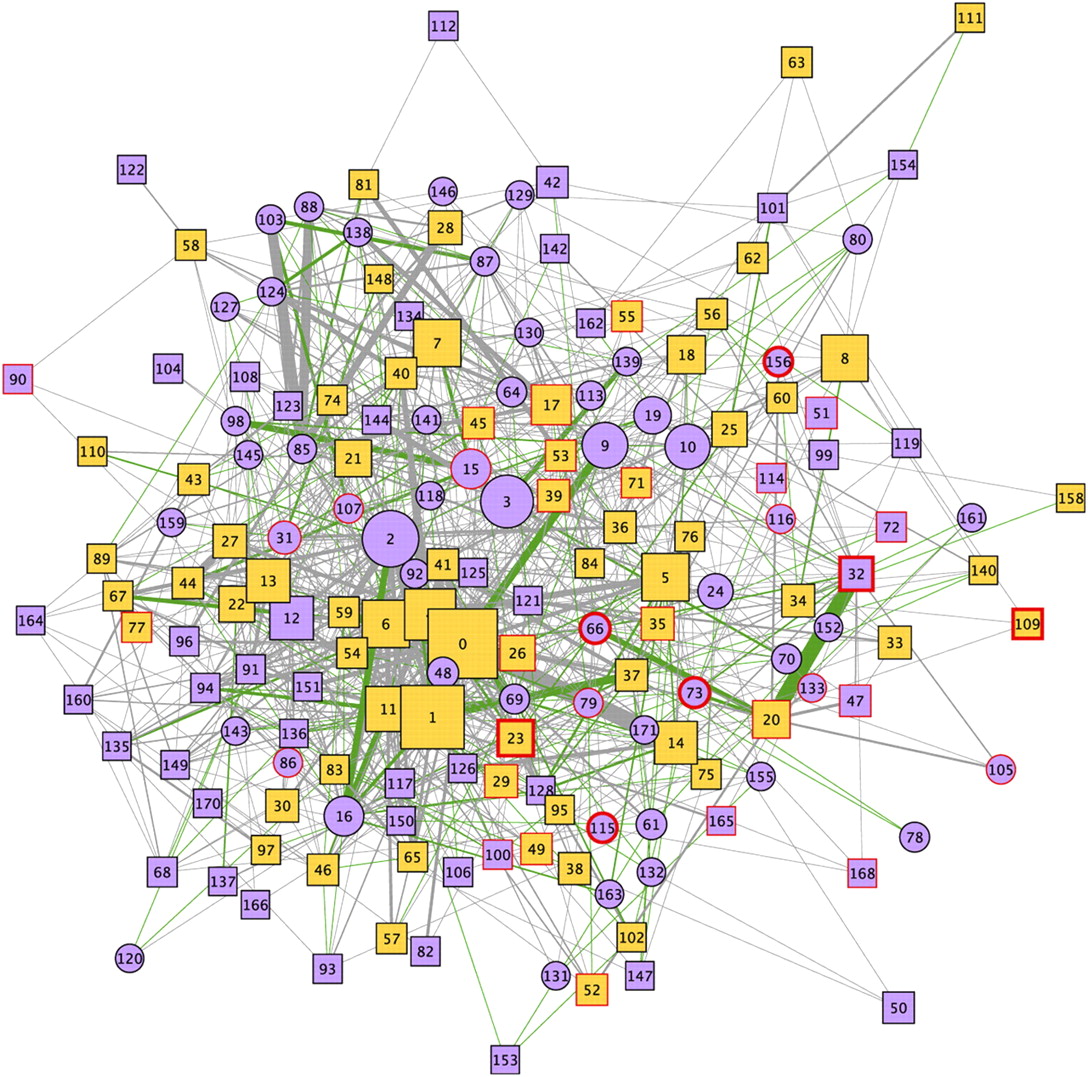
The modular structure of the AD-PIN. Representation of the network modules identified in the AD-PIN by the MCL algorithm. Functionally homogeneous modules are depicted as square nodes, and nonhomogeneous modules as circle nodes. Homogeneous modules that are enriched are in pale orange. Modules containing HC interactors have a thin red border, while those modules including AD seeds have a thick red one. Node labels correspond to the module identifiers provided in Supplemental File 2. The thickness of the edges is proportional to the number of interactions connecting two given clusters (max: 22; avg: 1.61; edges with at least two interactions: 257, 26.96%). Green edges (20.56% of the total, connecting 116 clusters) indicate if two clusters have at least one enriched/most abundant GO term in common.


