
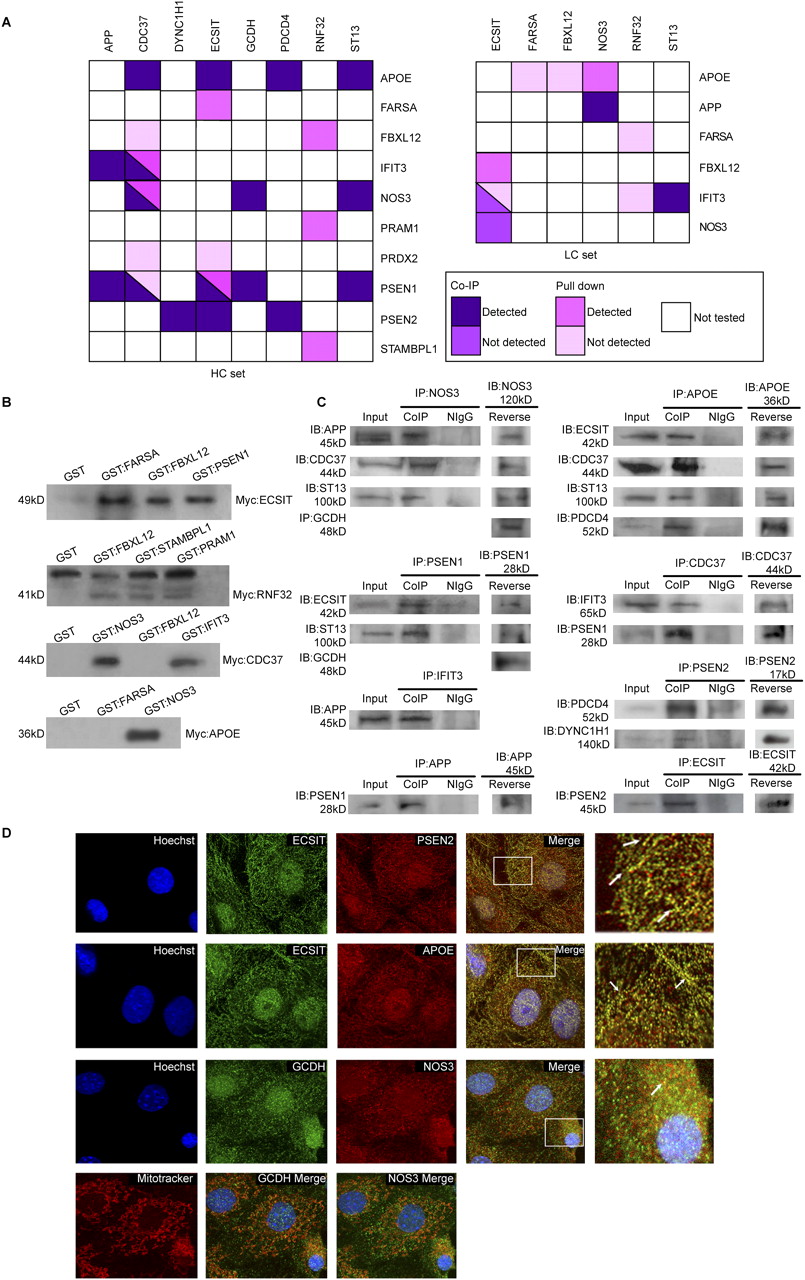
Validation of Y2H interactions by downstream binding assays. In vitro binding experiments: (A) schematic diagrams showing the interactions examined by co-IP or pull-down experiments, for the high-confidence (HC) and low-confidence (LC) sets, respectively; (B) by GST pull-down, blotting with anti-MYC antibody to detect the bound partner; (C) by coimmunoprecipitation (CoIP), blotting with a specific antibody for the bound partner, respectively. (Input) Cell lysate, used as loading control; (IP) immunoprecipitated protein; (IB) immunoblotted protein; (NIgG) nonimmune rabbit or mouse immunoglobulins, used as negative IP controls. When using NIgG as IP agent, no precipitation lines were detected against IB antibodies, indicating that CoIPs were protein-specific. Furthermore, reverse CoIPs using IB antibodies as IP agents, followed by IP antibodies for blotting, led to the same results in almost all cases, hence confirming the interactions. Expected molecular weights are also indicated. (D) In vivo colocalization of interacting partners by double immunofluorescence staining using confocal microscopy. (Upper panel) Double immunofluorescence confocal micrographs, labeled with a rabbit anti-ECSIT antibody and a secondary Alexa488-labeled anti-rabbit IgG (visualized in green pseudocolor), and with a mouse anti-PSEN2 visualized in red pseudocolor with a secondary Alexa568 labeled anti-mouse IgG (Invitrogen). Colocalized immunolabeling (merged window) appears as yellow staining in some areas (a framed area is also displayed in greater detail, see white arrows). Nuclei are displayed in blue by Hoechst staining. (Second panel) Double immunofluorescence of ECSIT and APOE following the same procedure. APOE was labeled with a mouse anti-APOE and an Alexa568 (visualized in red pseudocolor). (Third panel) Double immunofluorescence of GCDH labeled with a rabbit anti-GCDH and an Alexa488 (visualized in green pseudocolor), and NOS3 labeled with a mouse anti-NOS3 and an Alexa568 (visualized in red pseudocolor). (Bottom panel) Mitochondria staining with MitoTracker Deep Red stain (visualized in red pseudocolor). Merging with GCDH and NOS3 labeling, respectively, appears as yellow staining, indicating their mitochondrial localization.


