
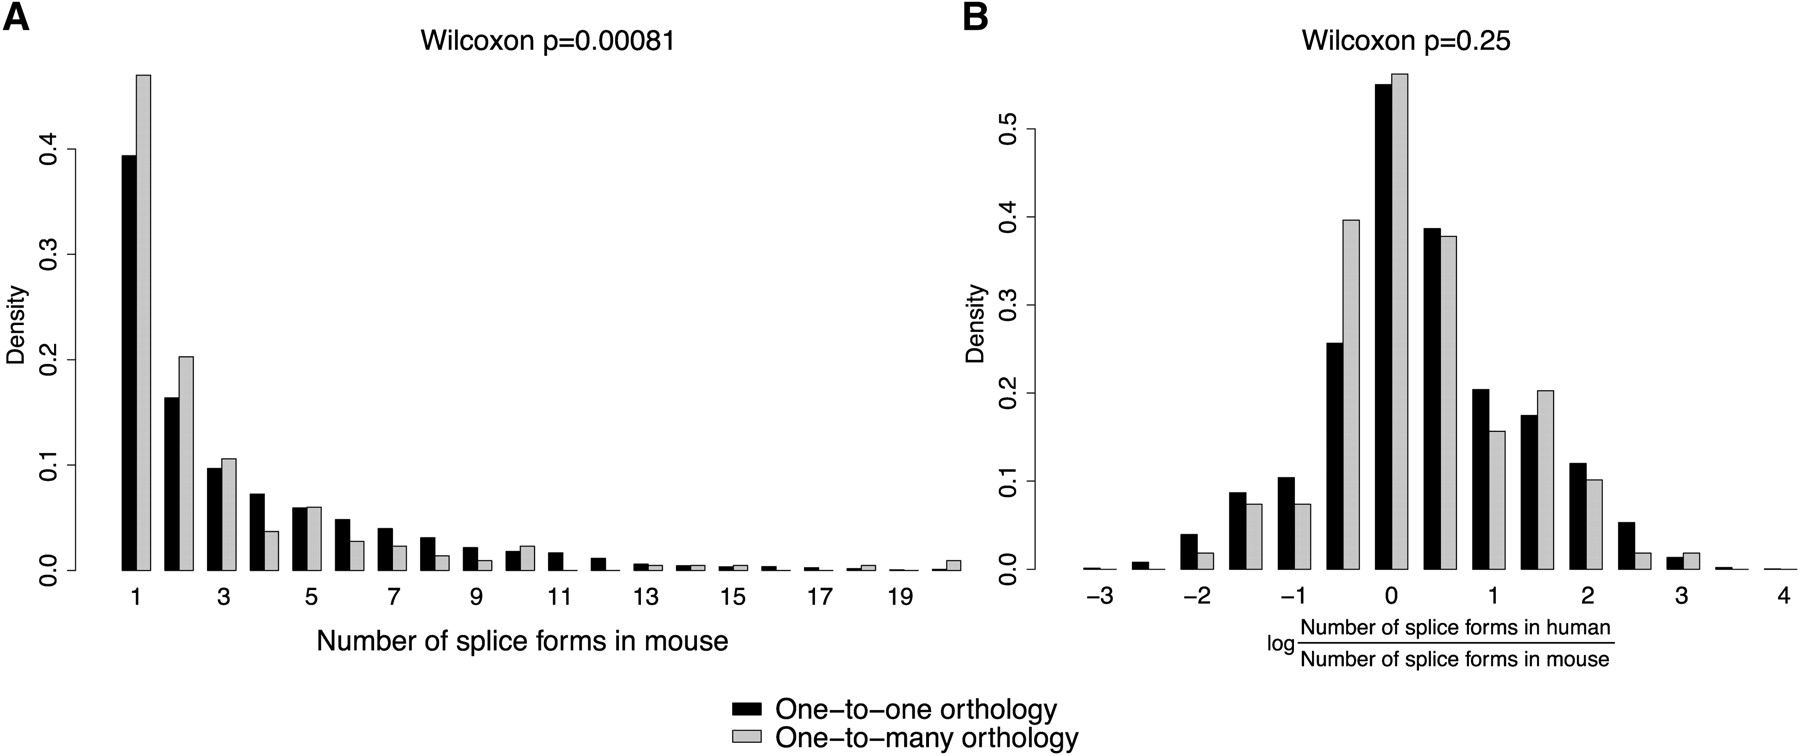
Relation between duplication and alternative splicing. (A) Histograms comparing the number of splice forms between mouse one-to-one orthologs of human genes (no duplication in the human lineage; black) and mouse one-to-many orthologs of human genes (at least one duplication in the human lineage; gray). (B) Histograms comparing the ratio of the number of splice forms between human genes and their mouse one-to-one orthologs (if no duplication occurred in the human lineage; black) or their mouse one-to-many orthologs (if at least one duplication occurred in the human lineage; gray). For the latter, the mean number of splice forms in human genes was used (see Methods).


