
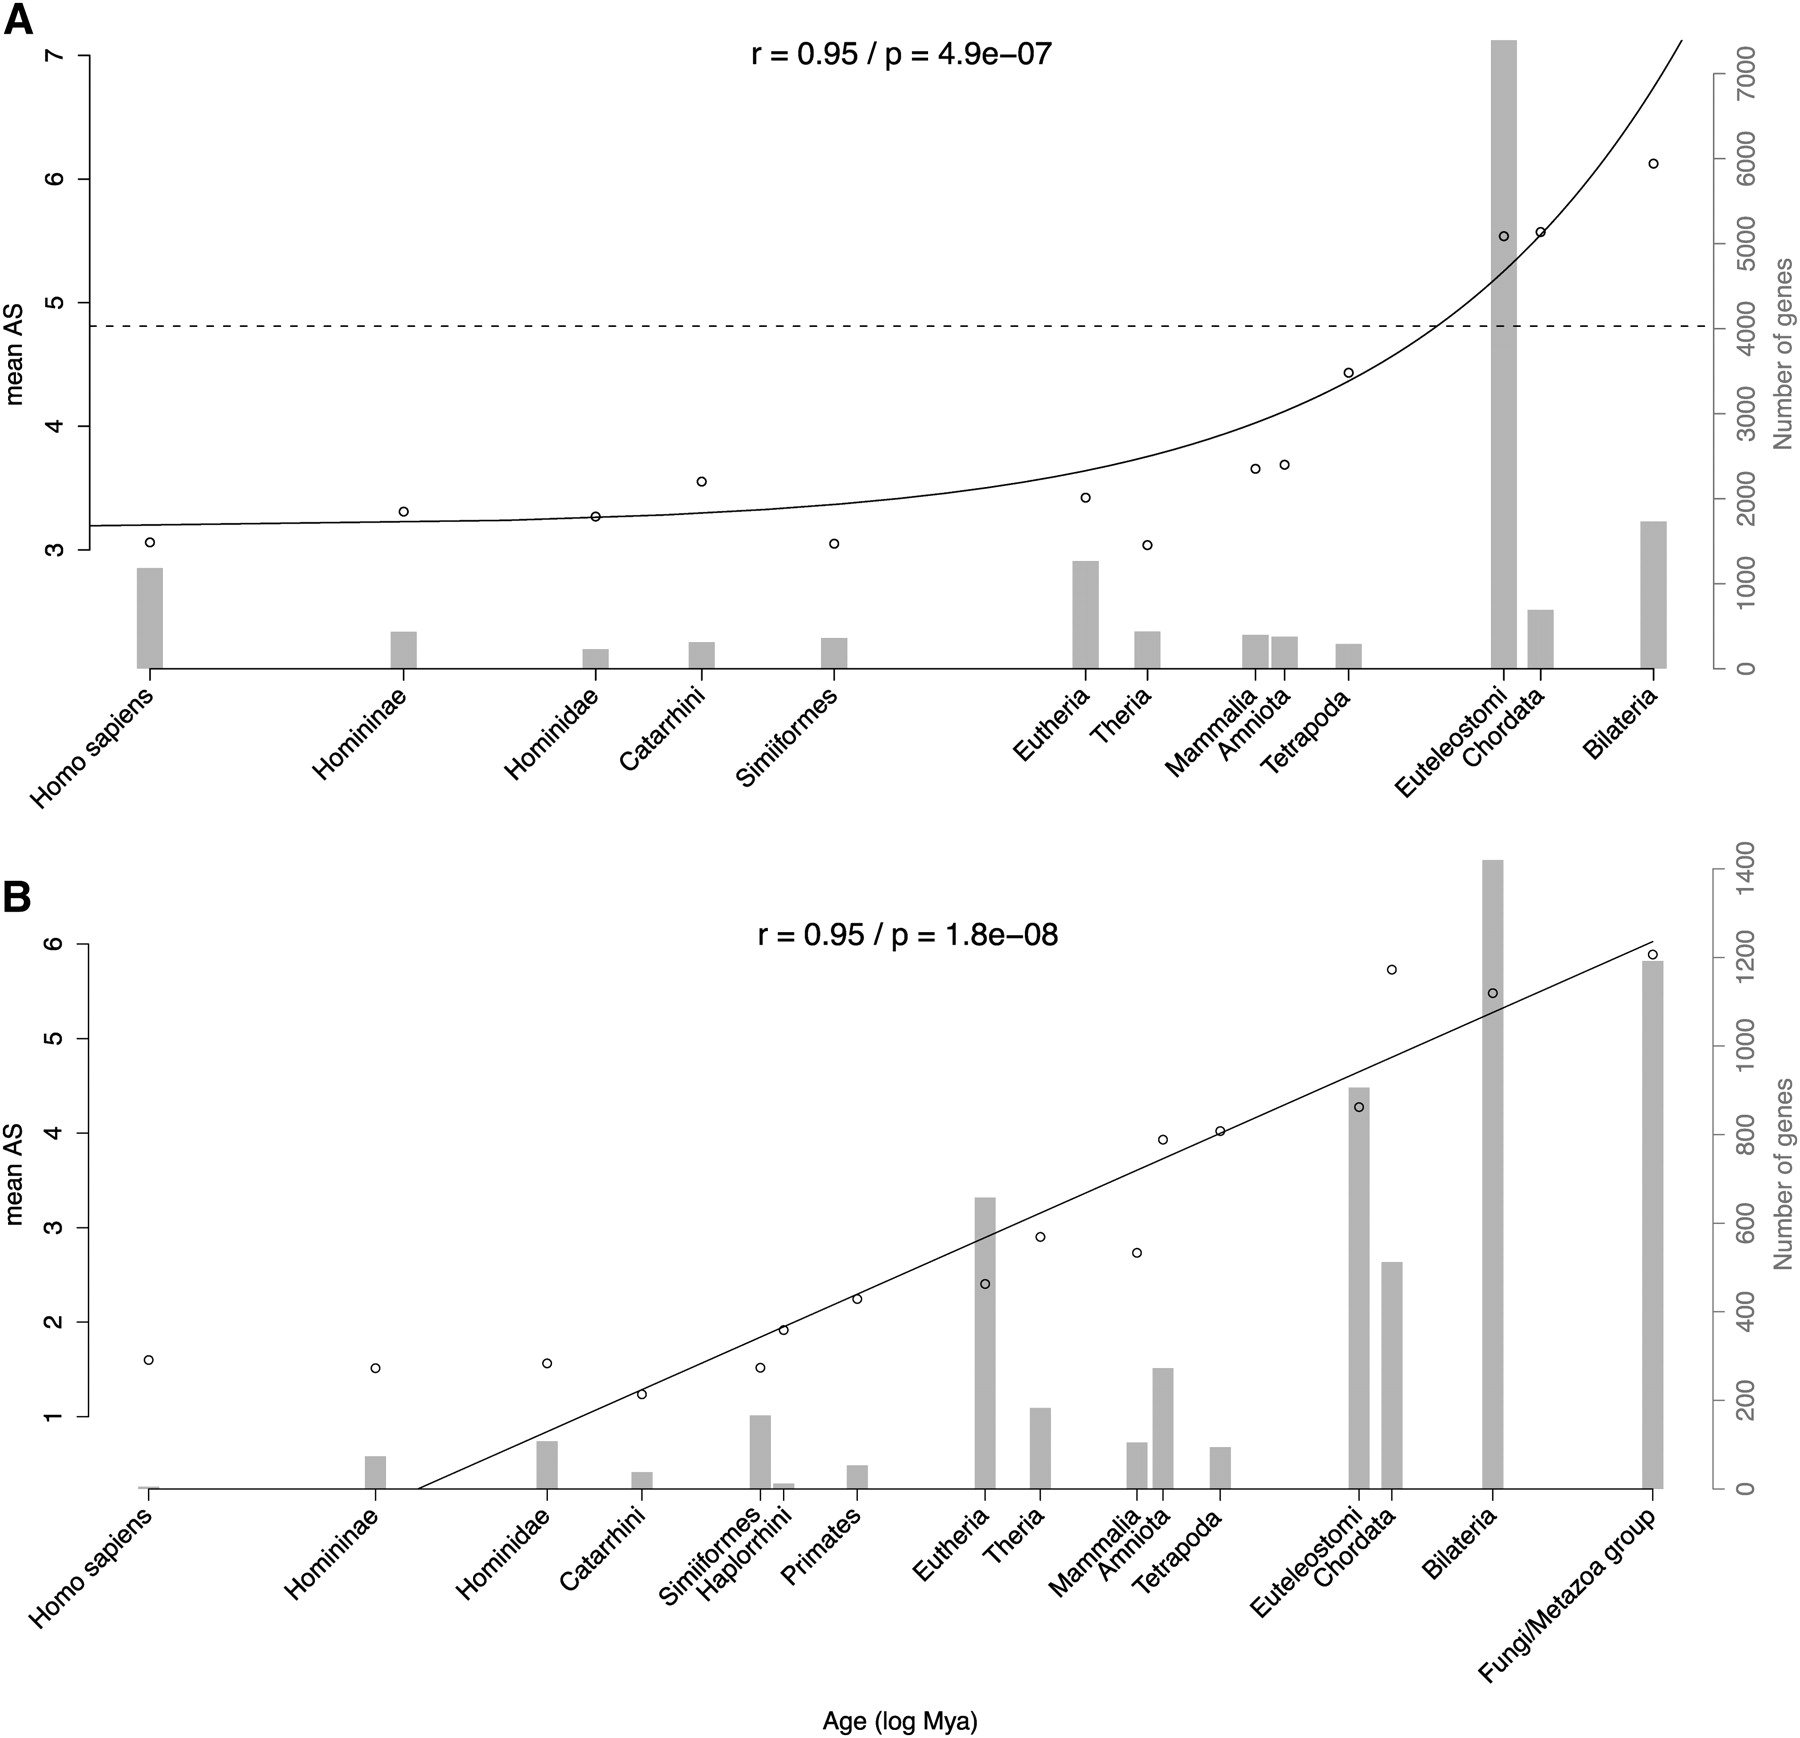
Relation between gene age and production of alternatively spliced variants in human. (A) Mean number of alternative spliced variants is plotted against the age of the last gene duplication. The dashed line represents the mean level of alternative splicing of genes that did not experience duplication (singletons). For better visualization, only age categories with more than 30 genes are shown. The gray background histogram represents the number of genes in each category of age (right y-axis). Similar results were obtained when using the fraction of genes undergoing alternative splicing (Supplemental Fig. S13). The x-axis is shown in log-scale. Estimates of divergence times in million years were obtained from the TimeTree database (see Methods). Only the taxonomic name of the lineage is displayed. A weighted linear regression was adjusted on the data, with real scale and log-transformed time. The best fitting model was kept, and the regression line, P-value, and r coefficients are displayed. (B) Mean number of alternative spliced variants is plotted against age of singletons. Similar results were obtained when using the fraction of genes undergoing alternative splicing (Supplemental Fig. S17).


