
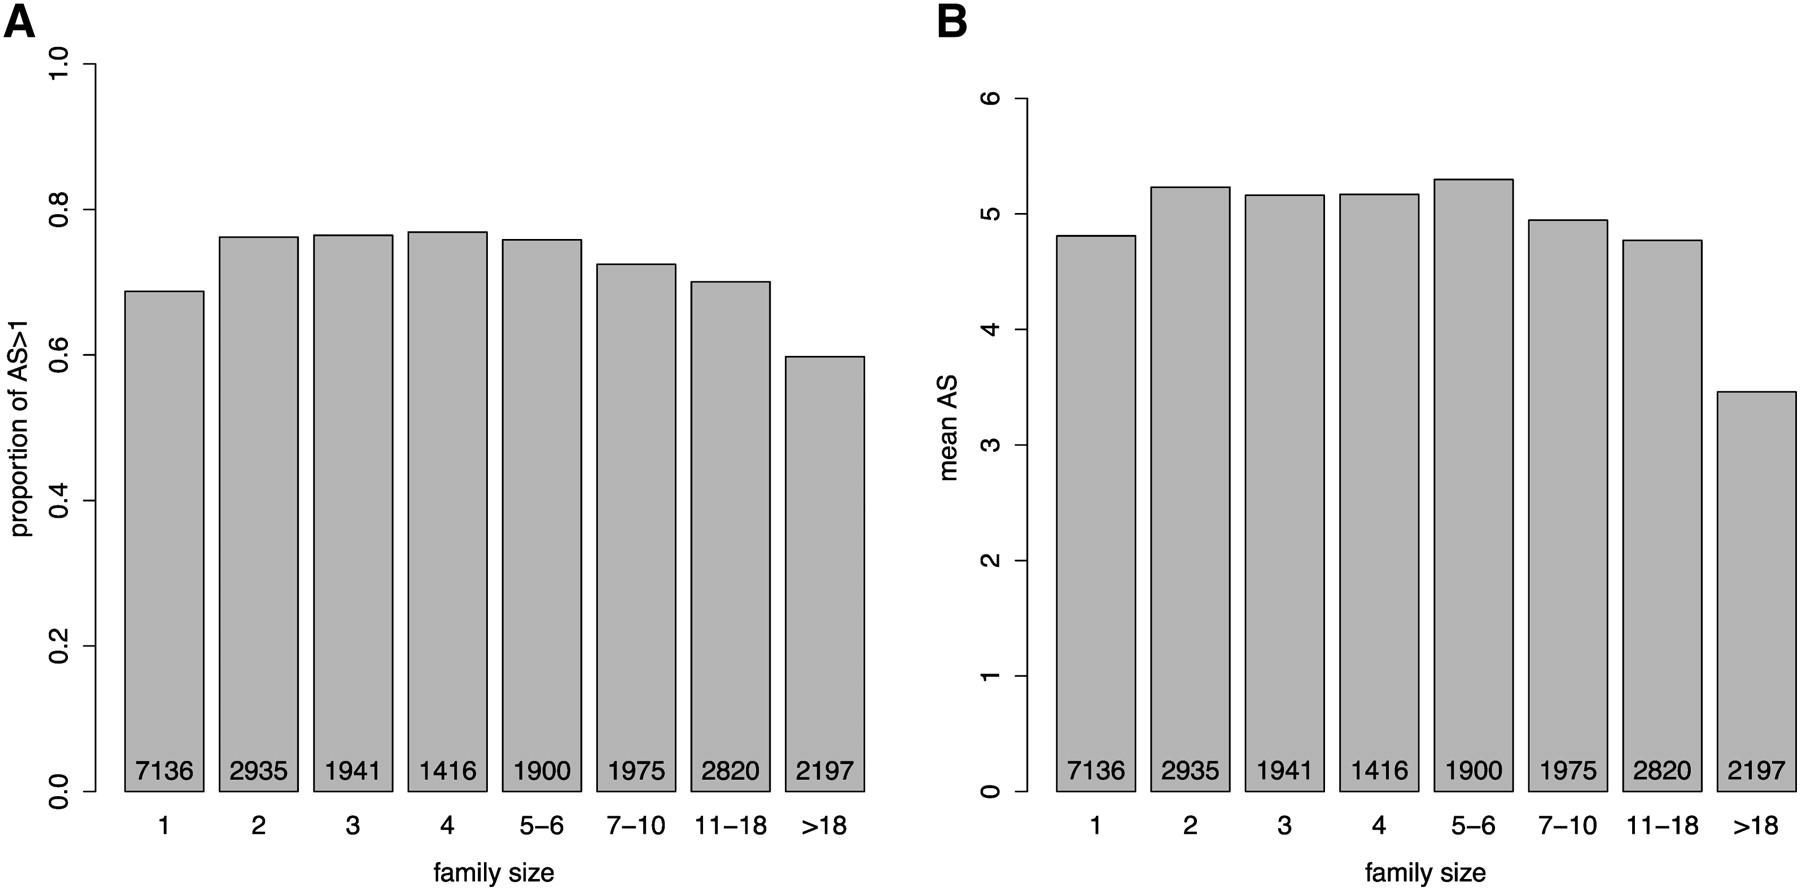
Figure 1.
Relation between gene family size and production of alternatively spliced variants in human genes. (A) Fraction of genes containing more than one splice variant (i.e., with alternative splicing). (B) Mean number of alternative spliced variants. Binning of family size was made as in Su et al. (2006), but the relation is independent of binning: Similar results were obtained when binning was made as in Kopelman et al. (2005) (Supplemental Fig. S1) or when no binning was made (Supplemental Fig. S2). The number of genes in each bin is indicated at the bottom of the bars.


