
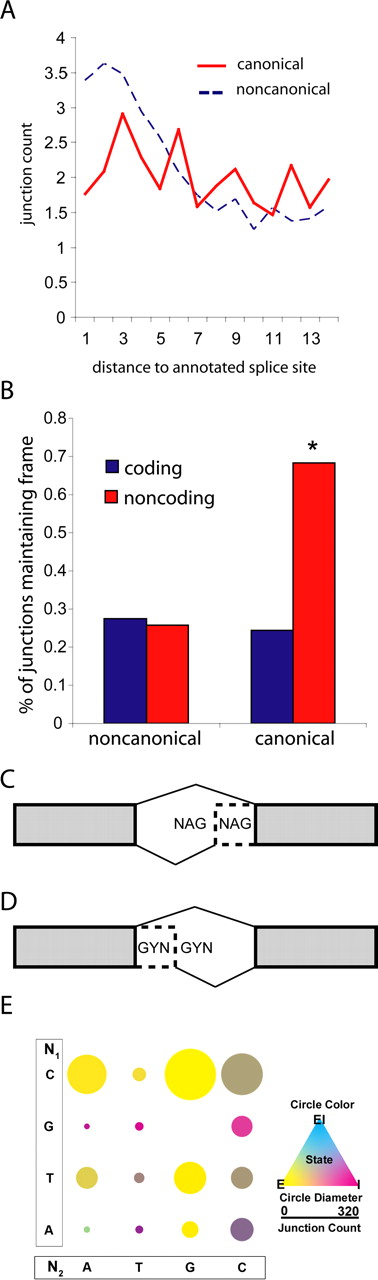
RNA-seq detects abundant subtle alternate splice isoforms. (A) Distribution of novel splicing junctions near annotated exon–exon junctions approximates the frequency of read indel events. The distance between novel splice sites and annotated splice sites is plotted separately for canonical and noncanonical novel junctions. (B) Canonical novel junctions in coding regions conserve frame. The portion of novel junctions which conserve frame is calculated for all candidate junctions across two partions: canonical/noncanonical and coding/noncoding. Only canonical novel junctions within coding regions conserve frame more than expected by chance (Binomial test n = 34,060, P-value = 2.2 × 10⁻¹⁶). (C) Constitutively splicing NAGNAGs can be exonic (E) and intronic (I), named for where the second NAG is incorporated. Alternate splicing NANAGs result in both E and I states. (D) Constitutively splicing GYNGYNs can be of two forms: exonic (e) or intronic (i), named for where the first GYN is incorporated. Alternate splicing GYNGYNs result in both e and i states. Diagram adapted from Hiller et al. (2006). (E) For each possible NAGNAG splice site N1 (A, T, G, or C) and N2 (A, T, G, or C), the genomic count (circular diameter) and the proportion of exonic (E), intronic (I), and alternative (EI) splicing (circle color) was calculated.


