
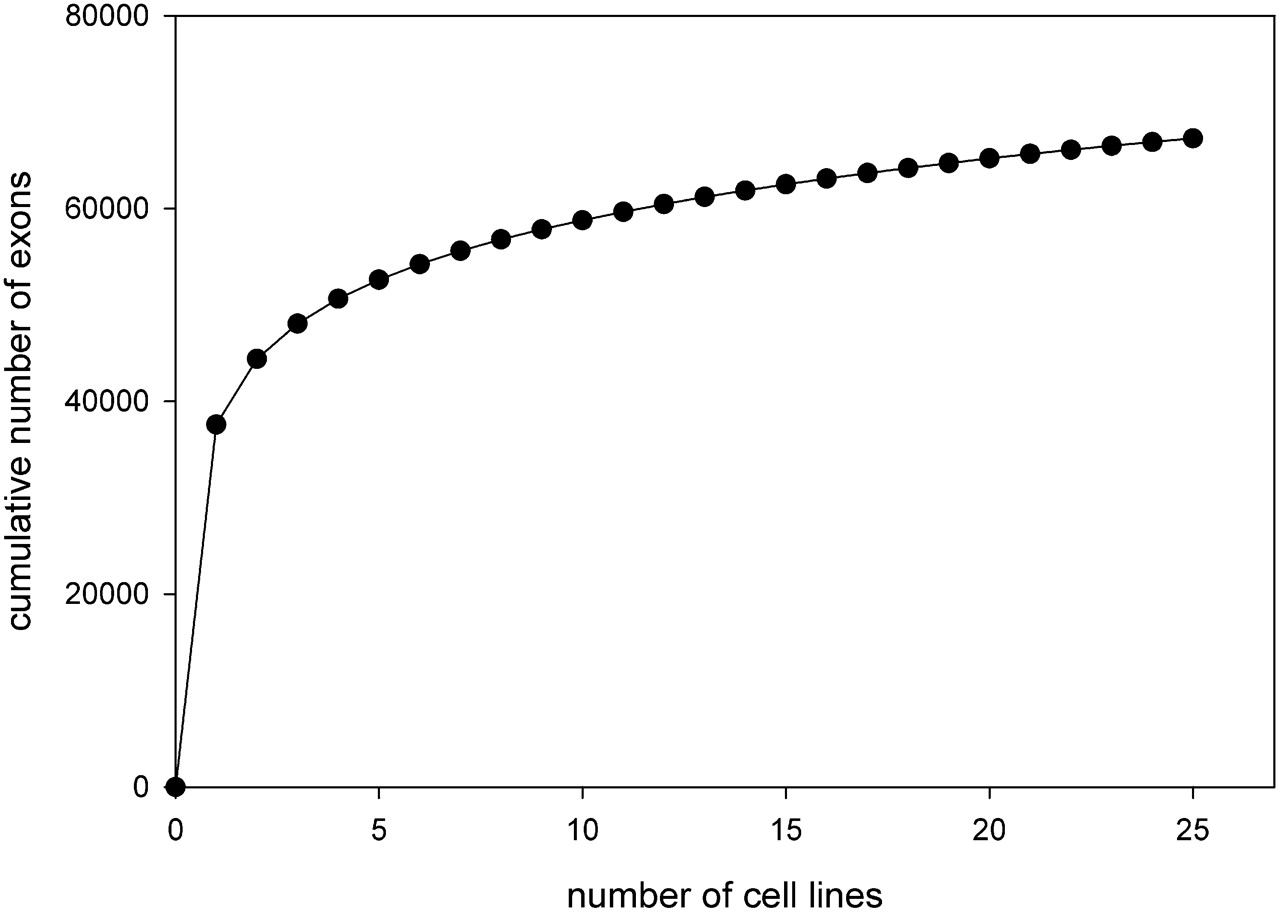
Figure 5.
Detection of known exons as a function of the cell lines studied. The number of annotated exons with detectable expression (score ≥ 200) in at least one cell line was computed as a function of the number of cell lines included in the calculation. The calculation was repeated 1000 times using randomly permuted orders for the addition of cell lines.


