
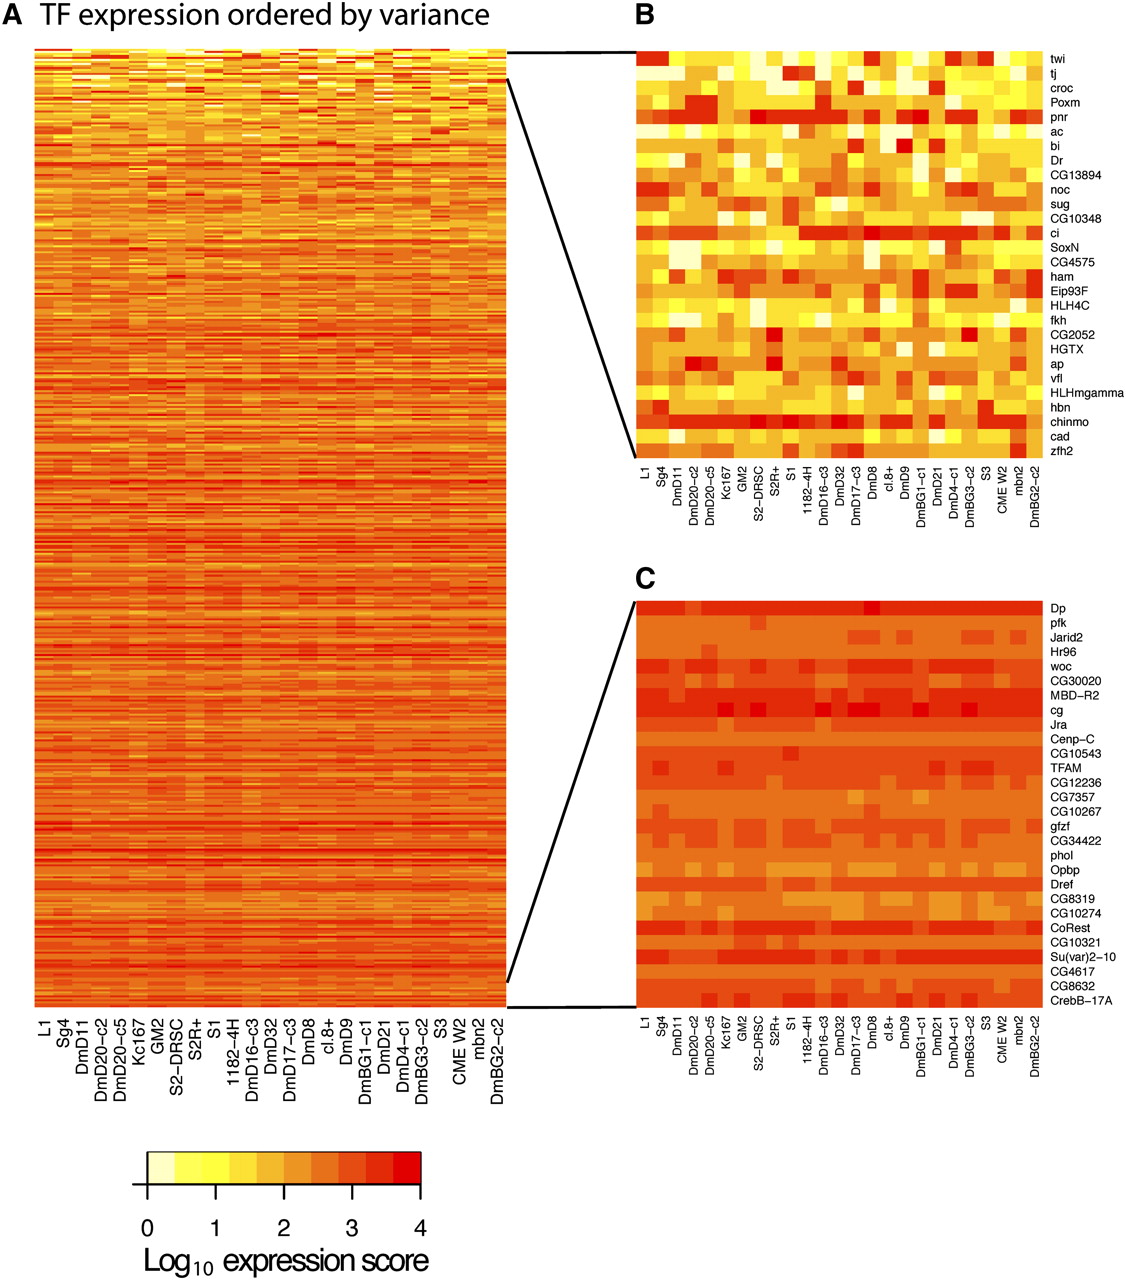
Figure 3.
Expression of transcription factors in 25 cell lines. The heat map indicates log10(expression score) for the genes indicated and for all 25 cell lines. The color key is shown below. (A) All 483 transcription factor genes detected in the cell lines. (B) The 28 transcription factor genes whose expression is most variable among the cell lines. (C) The 28 transcription factor genes exhibiting the least variation among the lines.


