
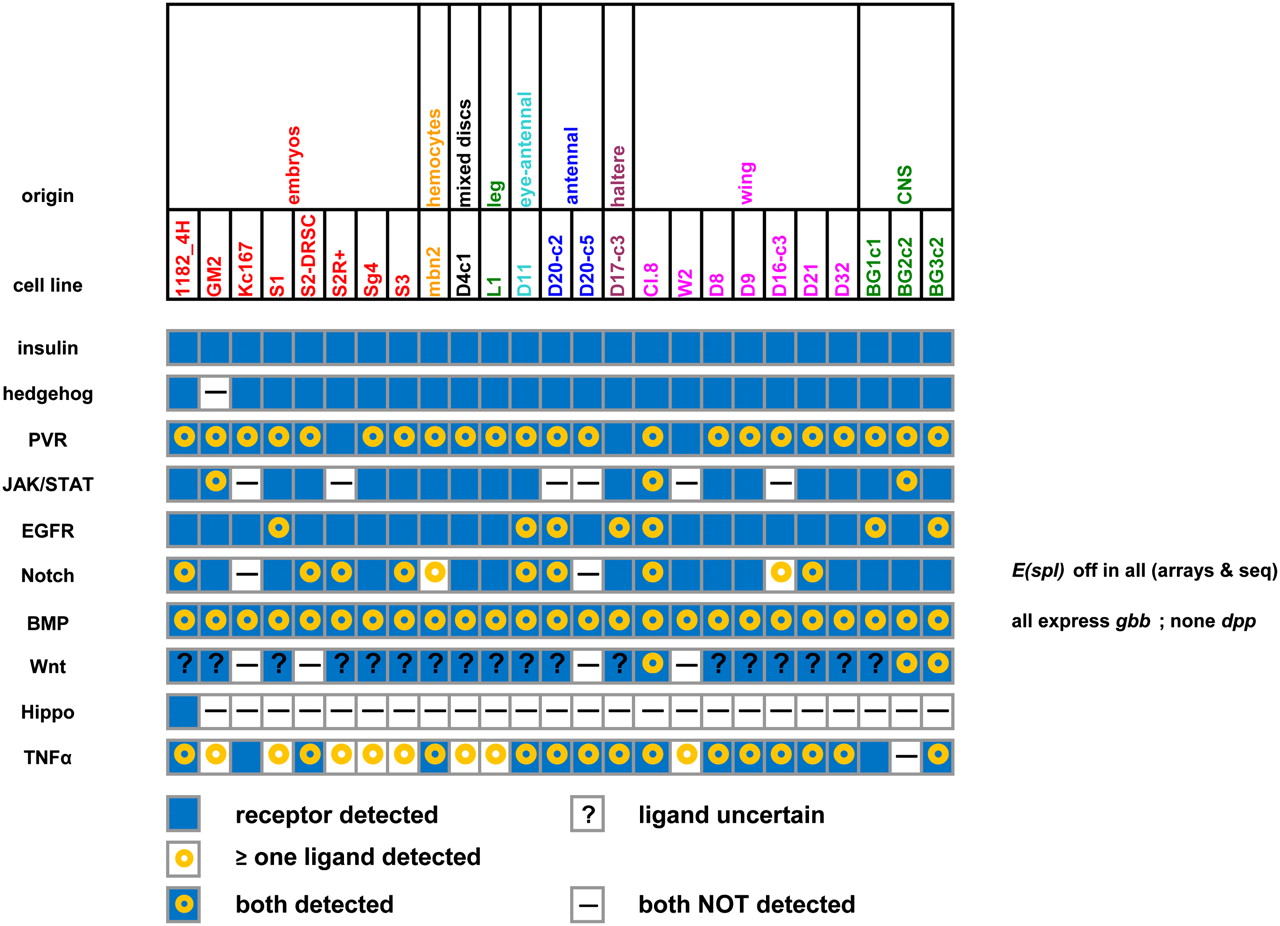
Figure 2.
Expression of key signaling pathways in the 25 cell lines. Summary data are shown for 10 pathways, indicating the expression of known ligands and receptors for each pathway in each cell line; for a more complete description, see text. Cell lines are color-coded according to the tissue origin, which is shown above.


