
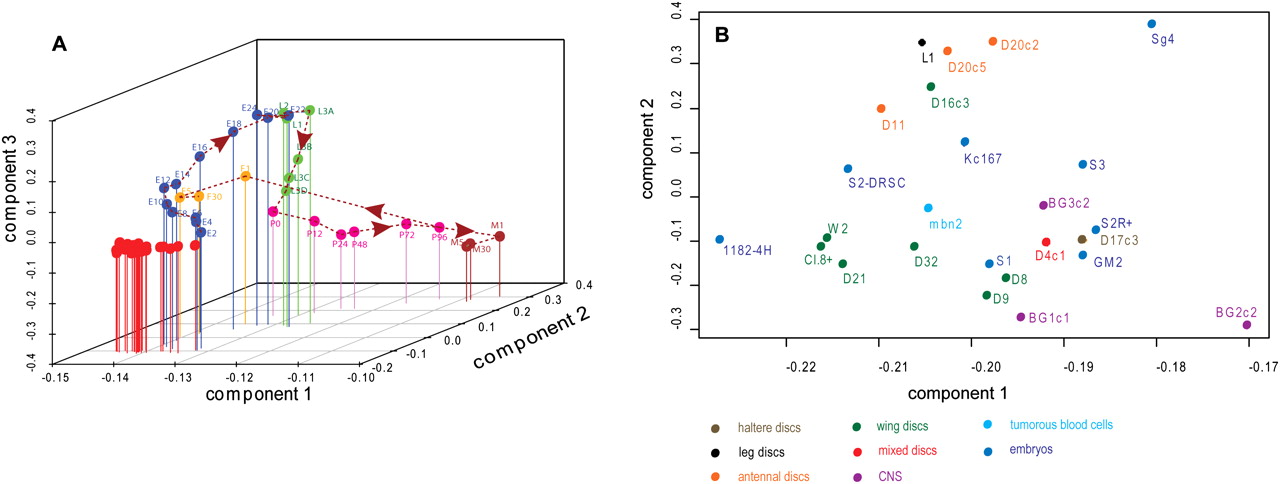
Clustering of cell lines by principal component analysis. (A) Clustering of cell lines with whole-animal developmental stages, showing components 1, 2, and 3. The whole-animal data were obtained using the same procedures as the cell line data (Graveley et al. 2011). (Red) Cell lines. (Dotted line) A trajectory for the developmental data. (Blue) Embryonic stages (Ex, where x is the time, in hours, at the end of a 2-h period measured from egg-laying); (green) larval stages (Lx where x is the instar number; 3A, 3B, 3C, and 3D represent sequential periods in the third larval instar); (pink) pupal stages (Px, where x is the time, in hours, after white prepupa); (brown) adult males (Mx, where x is the time, in days, after adult eclosion); (yellow) adult females (Fx, where x is the time, in days, after adult eclosion). (B) Clustering of 25 cell lines; components 1 and 2 are shown. Cell lines are color-coded to indicate the tissues from which they were derived; a key is shown below the graph.


