
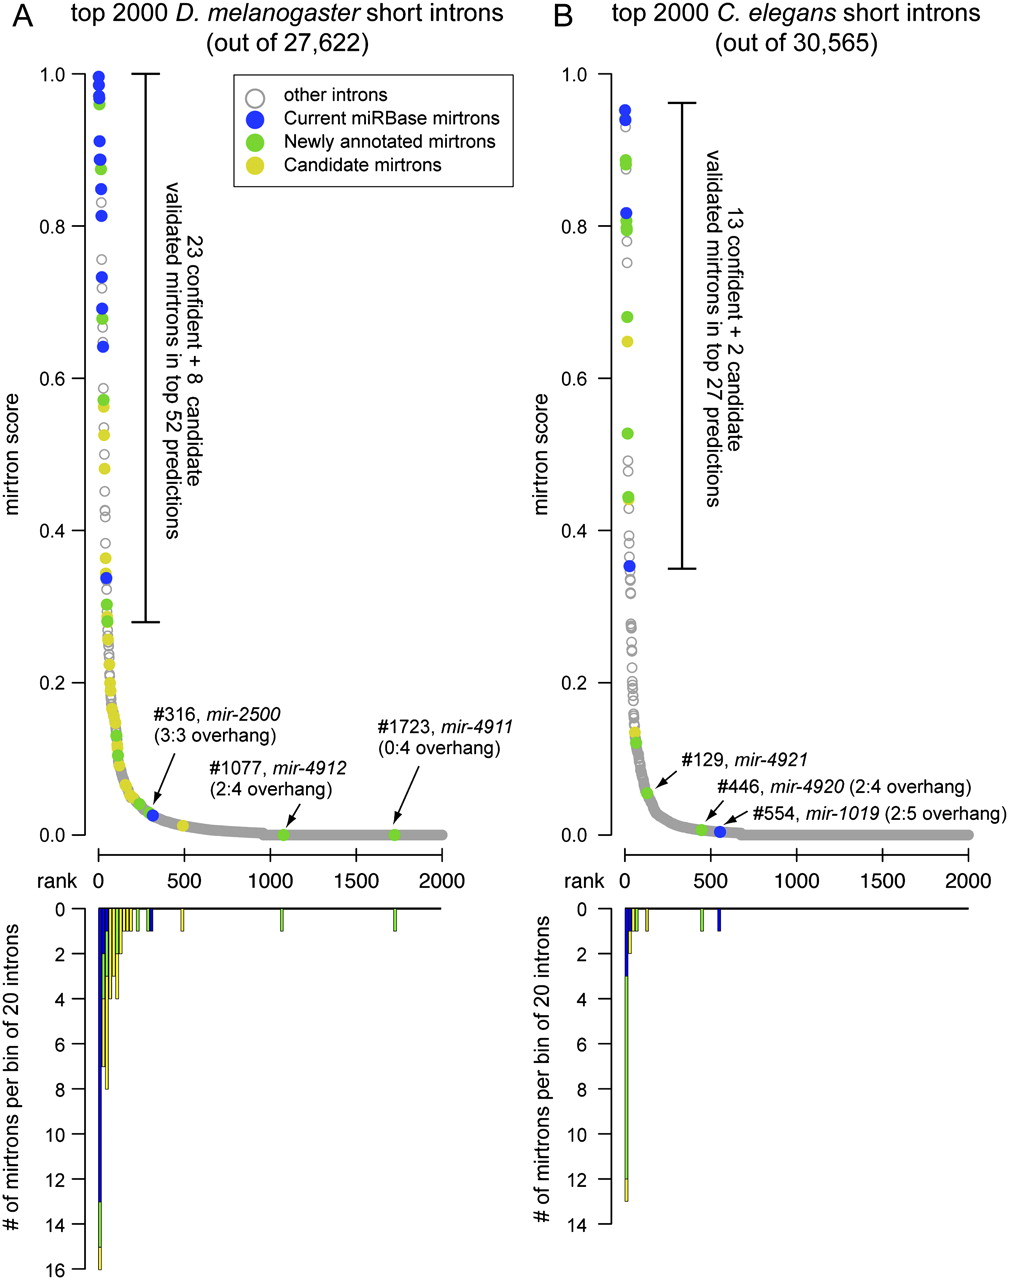
Performance of the computational model for mirtron identification on the D. melanogaster and C. elegans genomes. (A) Performance of an SVM trained on the 14 original D. melanogaster mirtrons (mir-1003-mir-1016) and run across the fly genome. (B) Performance of the D. melanogaster model on C. elegans. In both cases we used as input the annotated short introns 50–120 nt in length; no evolutionary features were considered. The top graphs plot the scores of mirtron likelihood and illustrate that the scores quickly drop following the top predicted candidates. Highlighted in blue are mirtrons previously deposited in miRBase (note that the previously annotated C. elegans mir-2220 was reported earlier but not recognized as a mirtron; it is nonetheless included in the “blue” loci), novel mirtrons annotated in this study are in green, and candidate mirtrons are highlighted in gold. The bottom graphs utilize the same x-axis and plot the numbers of validated and candiate mirtrons in consecutive bins of 20 introns in the rank order. Note that a few validated mirtrons scored poorly, and most of these have atypical 3′ overhangs. The full rankings can be viewed in Supplemental Tables S3 and S4.


