
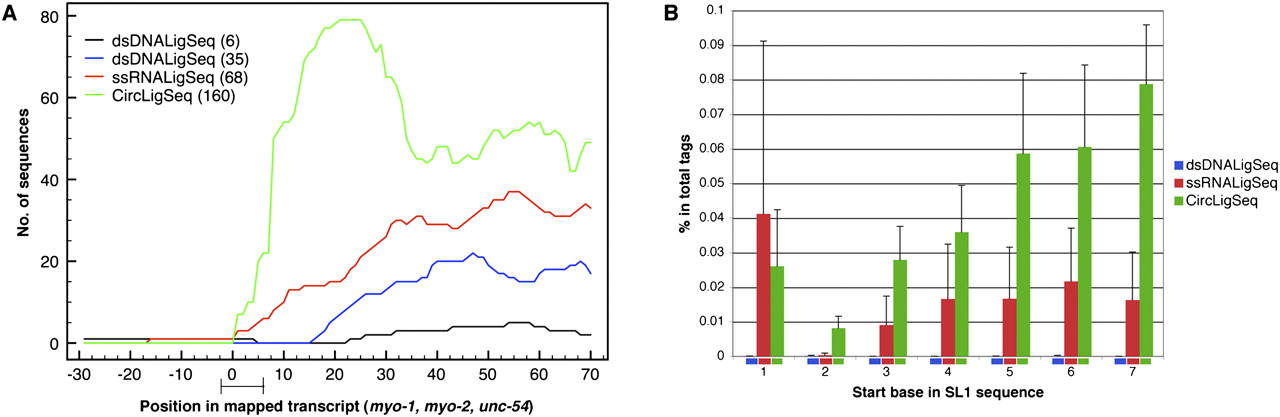
Coverage at the 5′ region of genes changes significantly among the different RNA-seq methods. (A) Transcript coverage on the 5′ region was determined by mapping sequences generated by the three different RNA-seq methods to the well-annotated start sites of the myo-1, myo-2, and unc-54 genes (Dibb et al. 1989; Okkema et al. 1993). The sequence tags were mapped using BLAT software. The plots depict transcript coverage from 30 bases before the annotated start sites to 70 bases after. The bar on the x-axis presents the 1–5 base ambiguity and variation in natural start sites (Dibb et al. 1989; Okkema et al. 1993). For clarity, only RNA-seqs from N2 mixed stage constructed by the ssRNALigSeq method (red), fem-1(hc17) constructed by dsDNALigSeq method (black), N2 at L4 larval stage constructed by the dsDNALigSeq method (blue), or N2 at L1 larval stage constructed by the CircLigSeq method (green) are shown. The overall number of sequences that aligned to the assayed region are indicated in parentheses. A lack of coverage at the extreme 5′ ends was also observed using data that were derived from a similar dsDNALigSeq method by Hillier et al. (2009) (Supplemental Fig. 7S). (B) Frequency of sequence reads starting in SL1 splice leader sequences. A start frequency at each of the first seven bases of SL1 was calculated for the three RNA-seq methods by counting the portion of the sequence tags that start with the relevant 16 SL1 bases. None of these 16-mers is found in the C. elegans transcriptome outside of SL1. (Blue) dsDNALigSeq method; (red) ssRNALigSeq method; (green) CircLigSeq method.


