
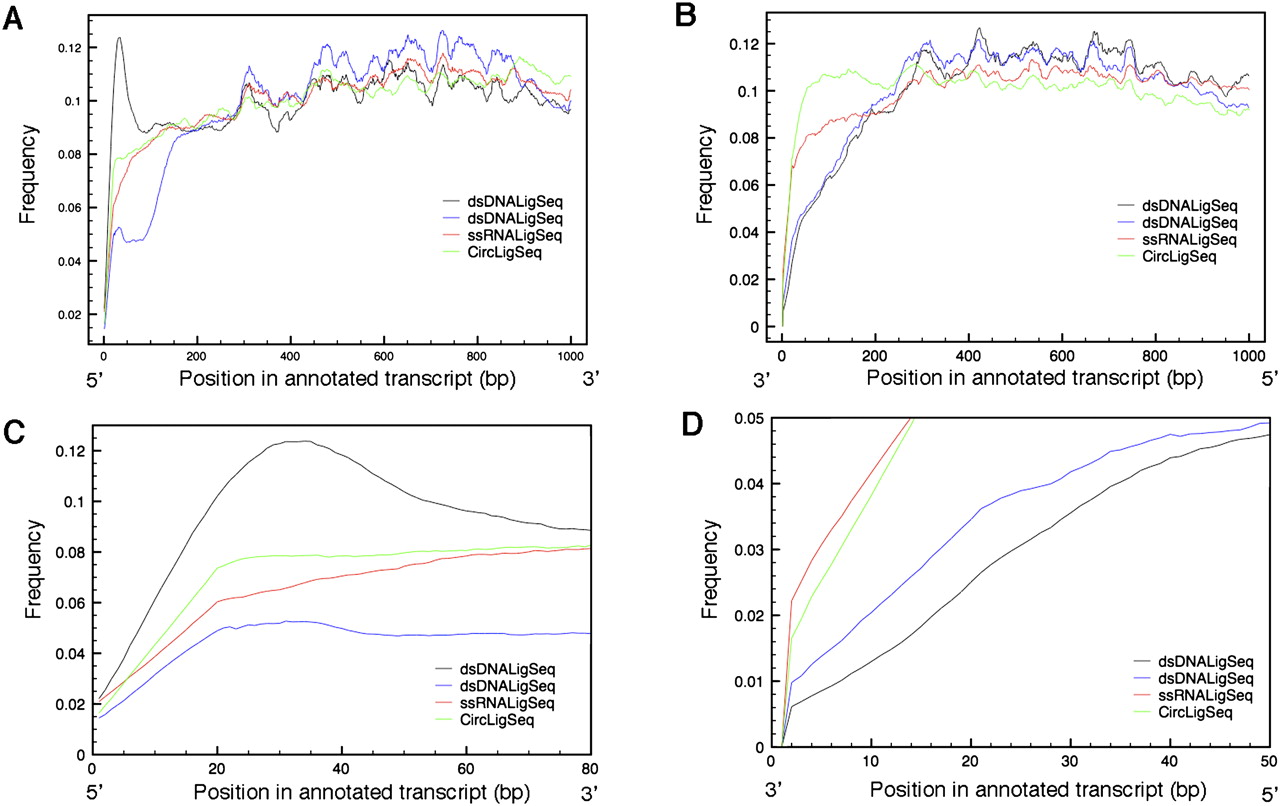
Transcript coverage by position by variety of RNA-seq methods. Transcript coverage was determined by comparing transcript position of RNA-seq tags generated by the dsDNALigSeq, ssRNALigSeq, and CircLigSeq methods. The sequence tags were mapped using BLAT software. Only transcripts that are longer then 1000 bp were considered in the analysis. The plots depict transcript coverage from the start of the transcript (A,C) or from the end of the transcript (B,D). C and D are magnified representations of A and B, respectively. For clarity, only RNA-seqs from N2 mixed stage constructed by the ssRNALigSeq method (red), fem-1(hc17) constructed by dsDNALigSeq method (black), N2 at L4 larval stage constructed by dsDNALigSeq method (blue), or N2 at L1 larval stage constructed by CircLigSeq method (green) are shown. The somewhat uneven coverage along the length of a canonical gene appears partly due to disproportionate contributions by a fraction of highly expressed genes.


