
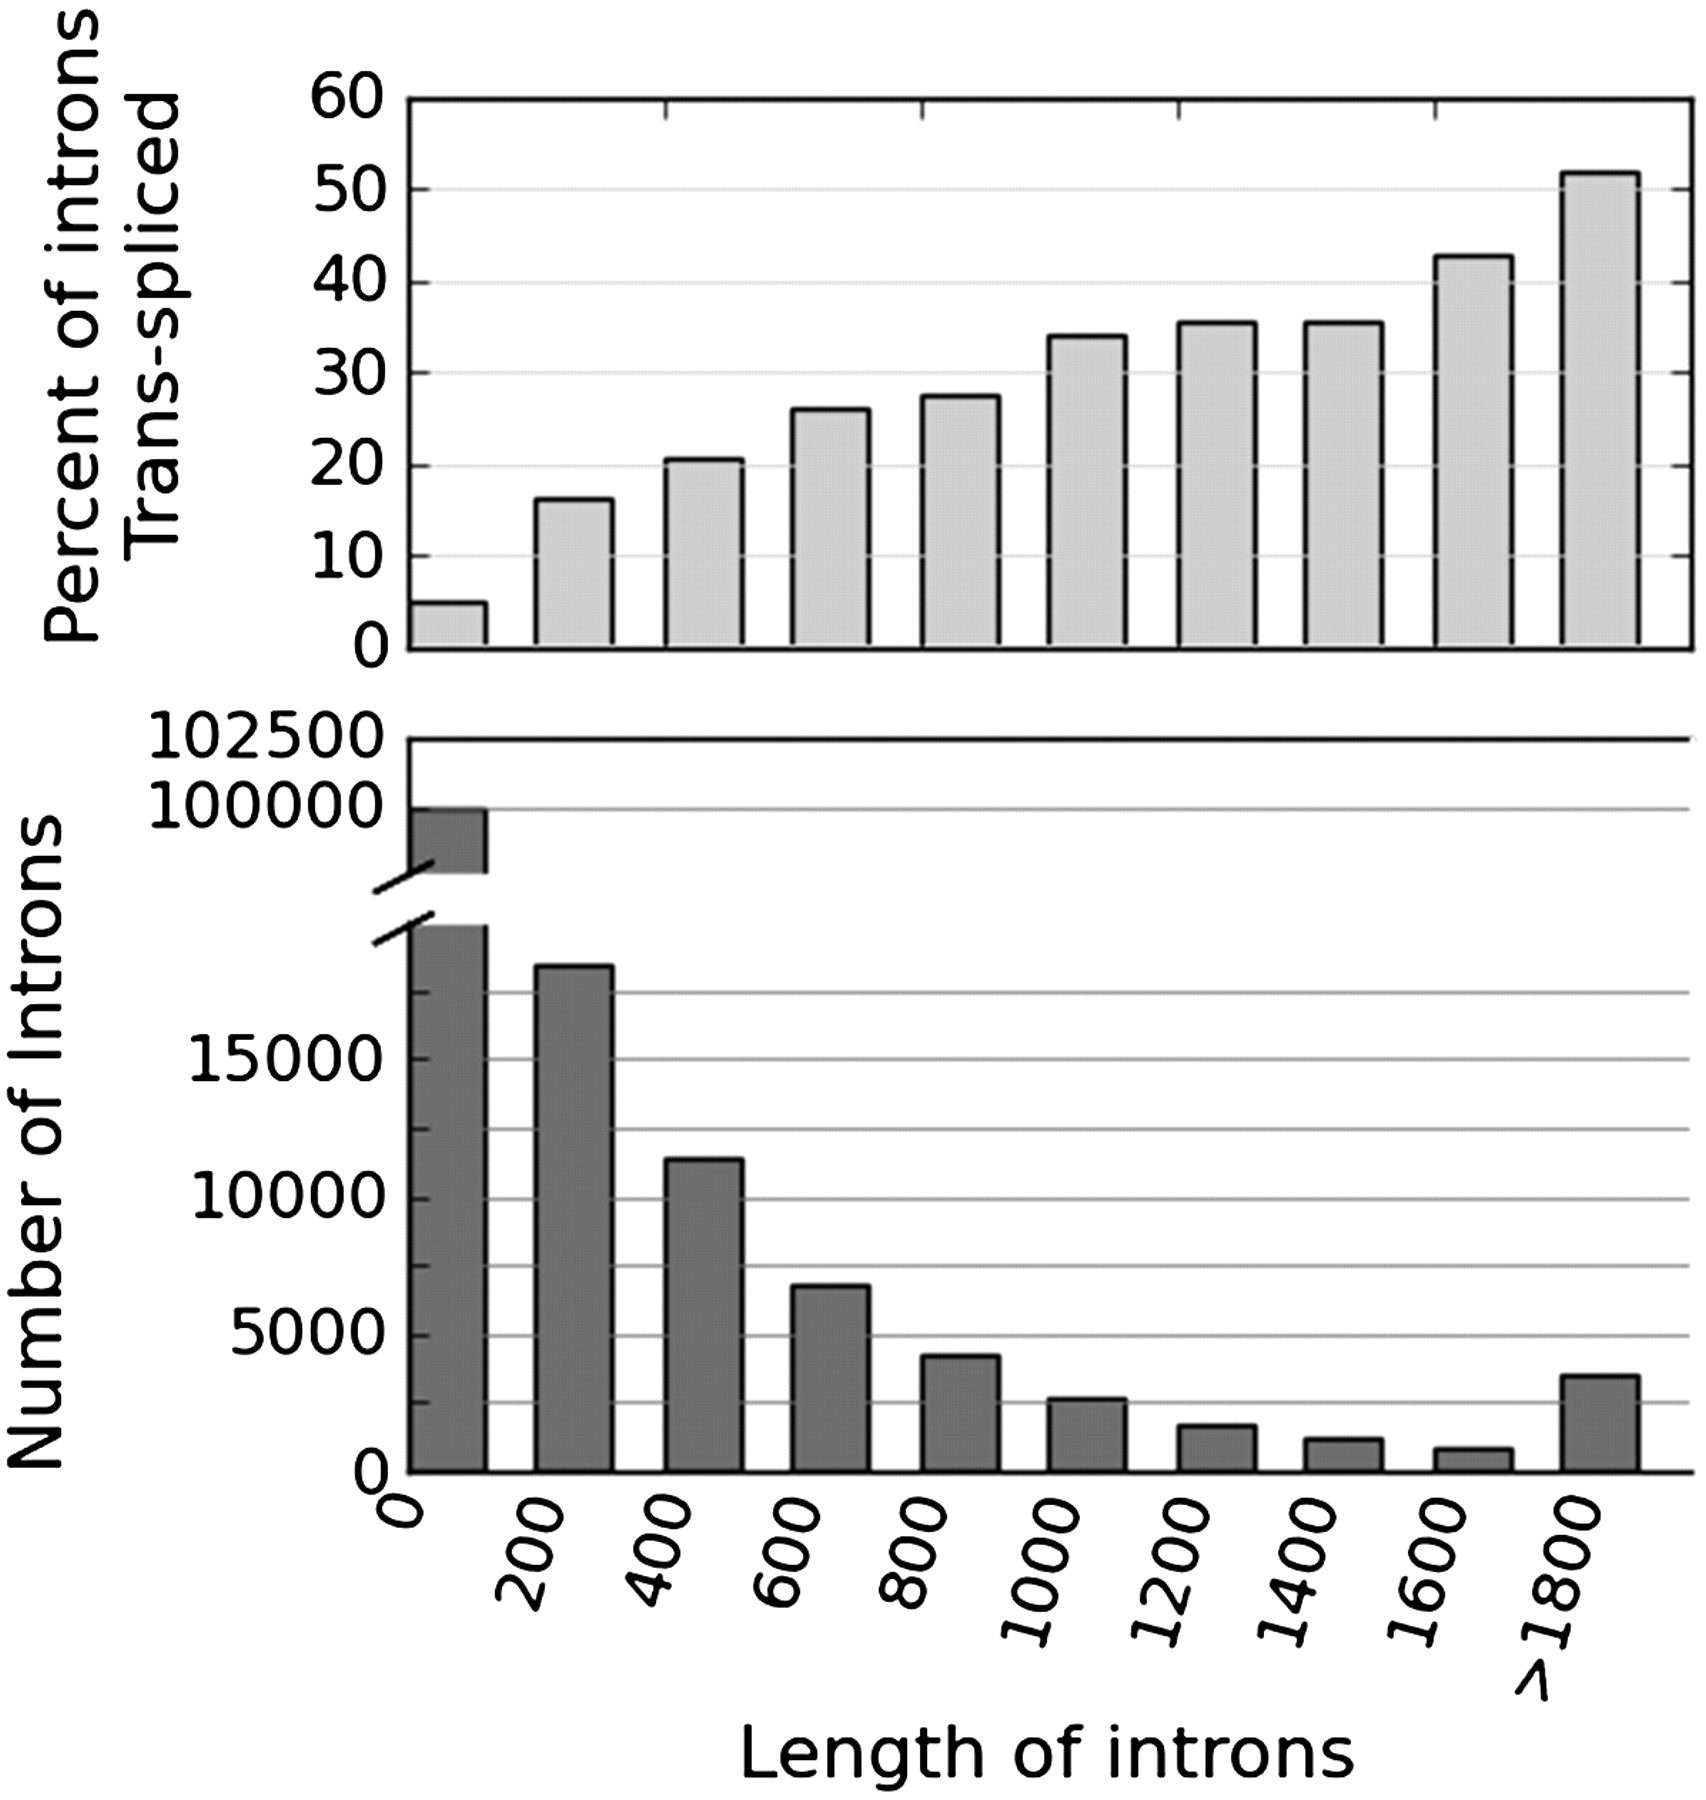
Figure 7.
Rare trans-splicing at intron 3′ splice sites vs. intron length. Sites at which some trans-splicing occurred were mapped to annotated intron 3′ splice sites. Introns were divided into bins of 200 nt according to their length, with the number indicating the lower end of the bin. The bottom graph shows the number of introns in the genome with the indicated length, and the top graph shows the percent of the introns in each bin that have at least one associated trans-splicing event.


