
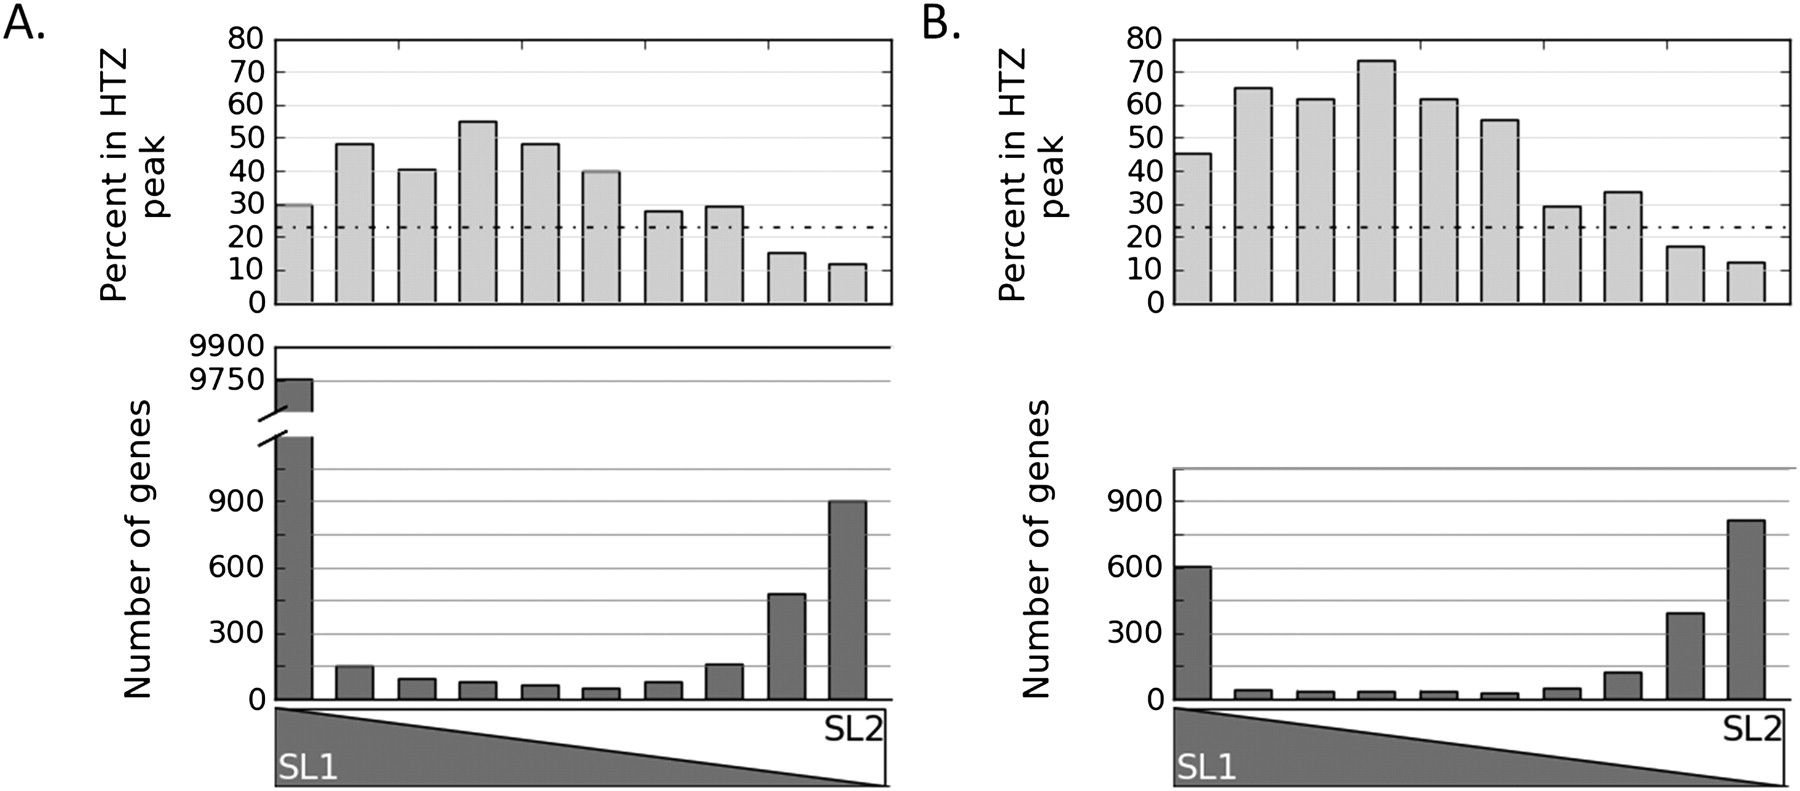
Figure 5.
Relationship between trans-splicing specificity and proximal promoters. (Bottom) Histogram of the total number of genes with indicated SL1/SL2 proportion. (Top) The percent of those genes associated with a peak of the minor histone HTZ, which marks promoters (Whittle et al. 2008). (A) Genes with low percent SL2 (high SL1) are more likely to be in an HTZ peak than genes with high SL2. Trans-splices sites with mixed SL are the category most likely to be in an HTZ peak. (B) When genes with <500-bp intercistronic distance are analyzed, those with high SL1 are even more likely to be in an HTZ peak. Dotted line indicates the percent of all genes with an HTZ peak (Whittle et al. 2008).


