
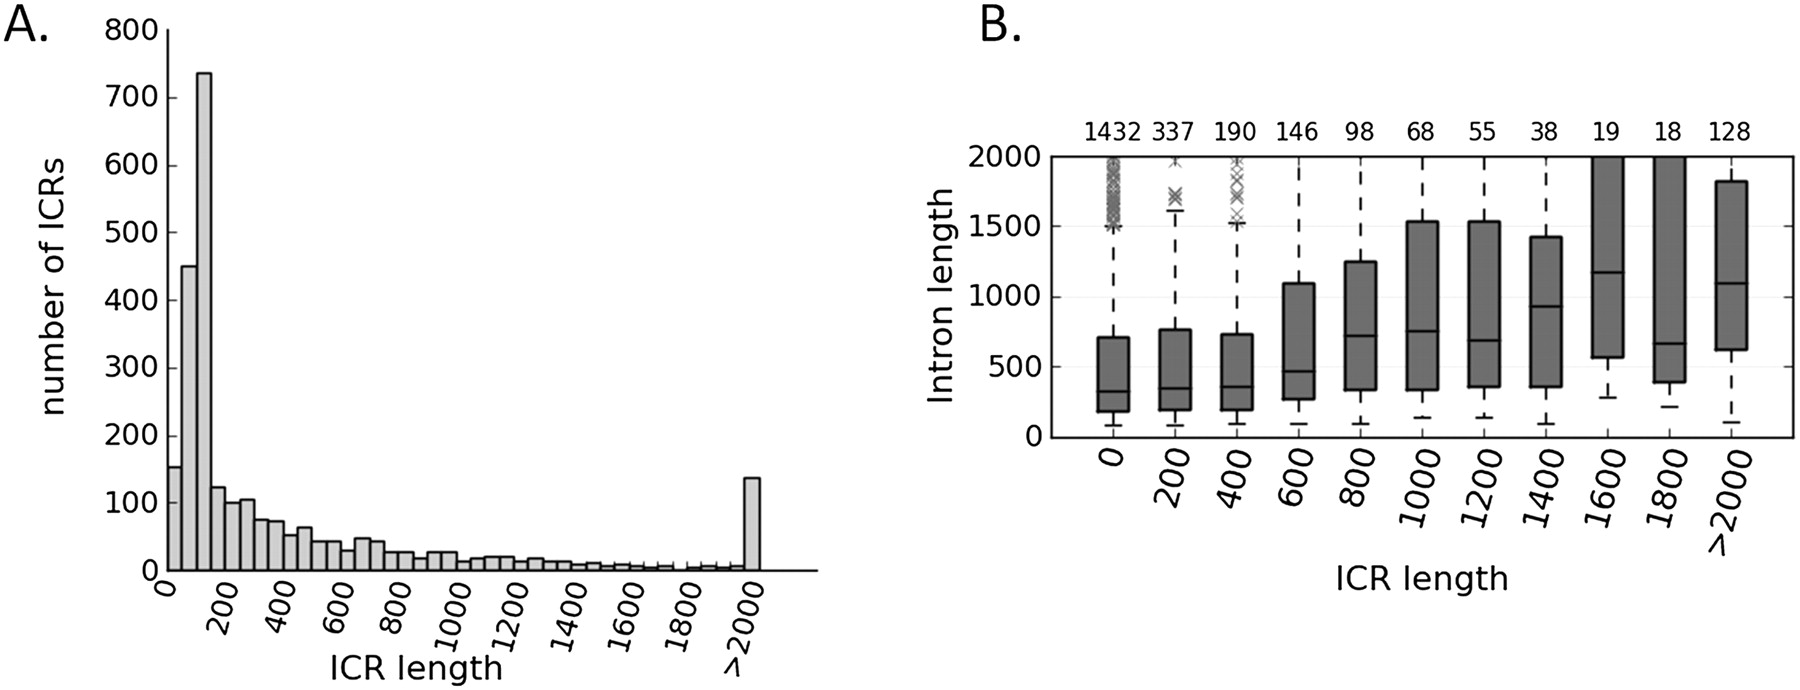
Figure 4.
ICR length vs. gene length. (A) Histogram of all ICRs shows that most ICRs are <200 nt long. ICR length is in bins of 50 nt. Number of ICRs with the indicated length is shown on the y-axis. (B) Box-and-whiskers plot of average intron length of the genes upstream and downstream of the ICR vs. the ICR length. The number of genes in each category is indicated by numbers above the graph. ICR lengths are in bins of 200 nt.


