
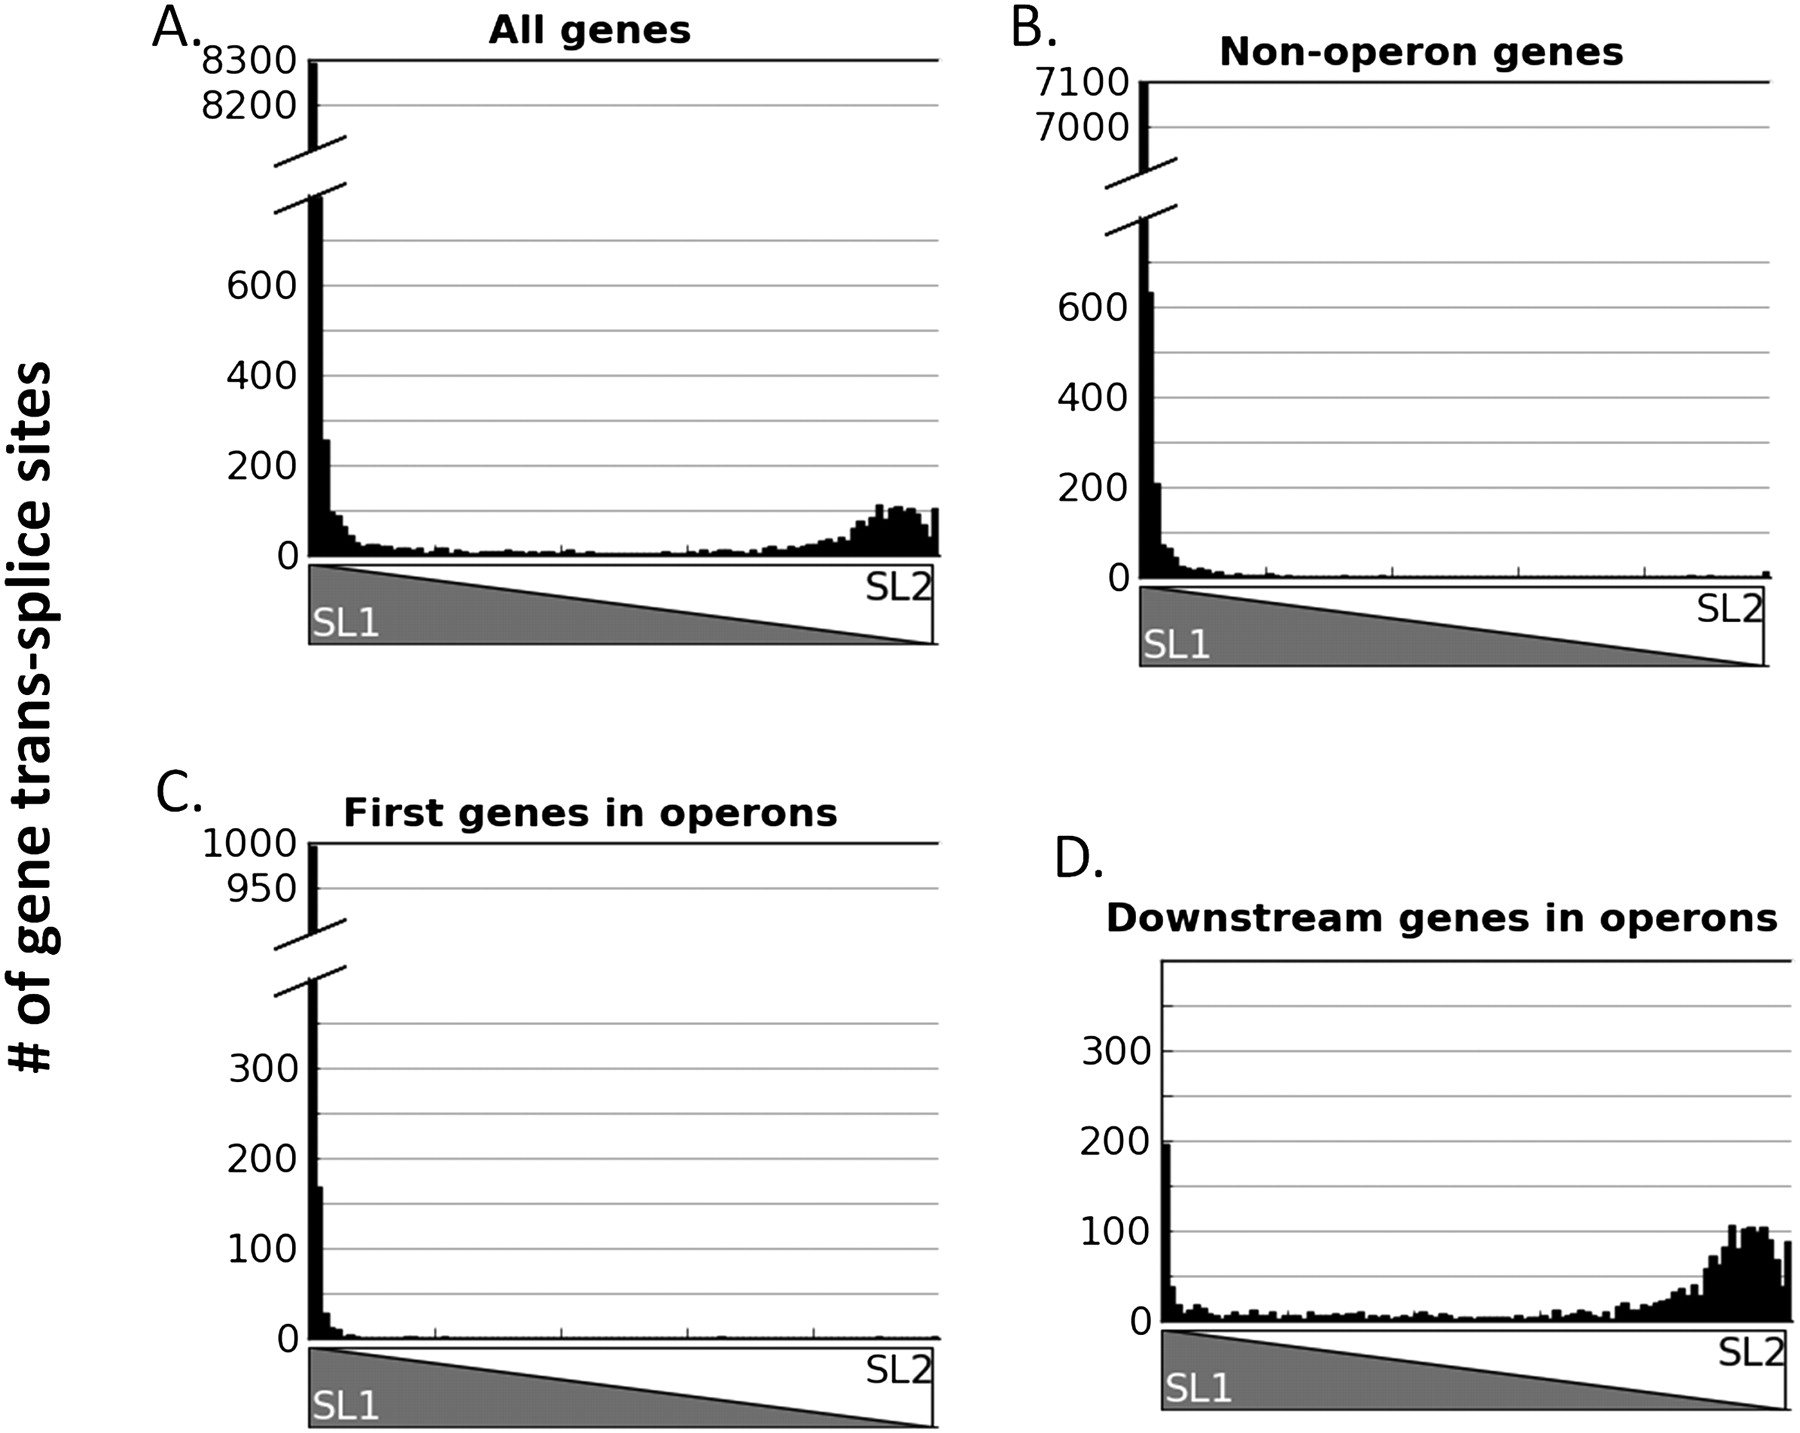
Figure 2.
SL1/SL2 trans-splicing ratios at each trans-spliced gene. Histogram showing the number of gene trans-splice sites with indicated SL1:SL2 proportion on the y-axis. The x-axis shows the proportion SL1/SL2 by the opposing triangles and ranges from 100% SL1 to 100% SL2. (A) All genes; (B) non-operon genes; (C) first genes in operons; (D) downstream genes in operons.


