
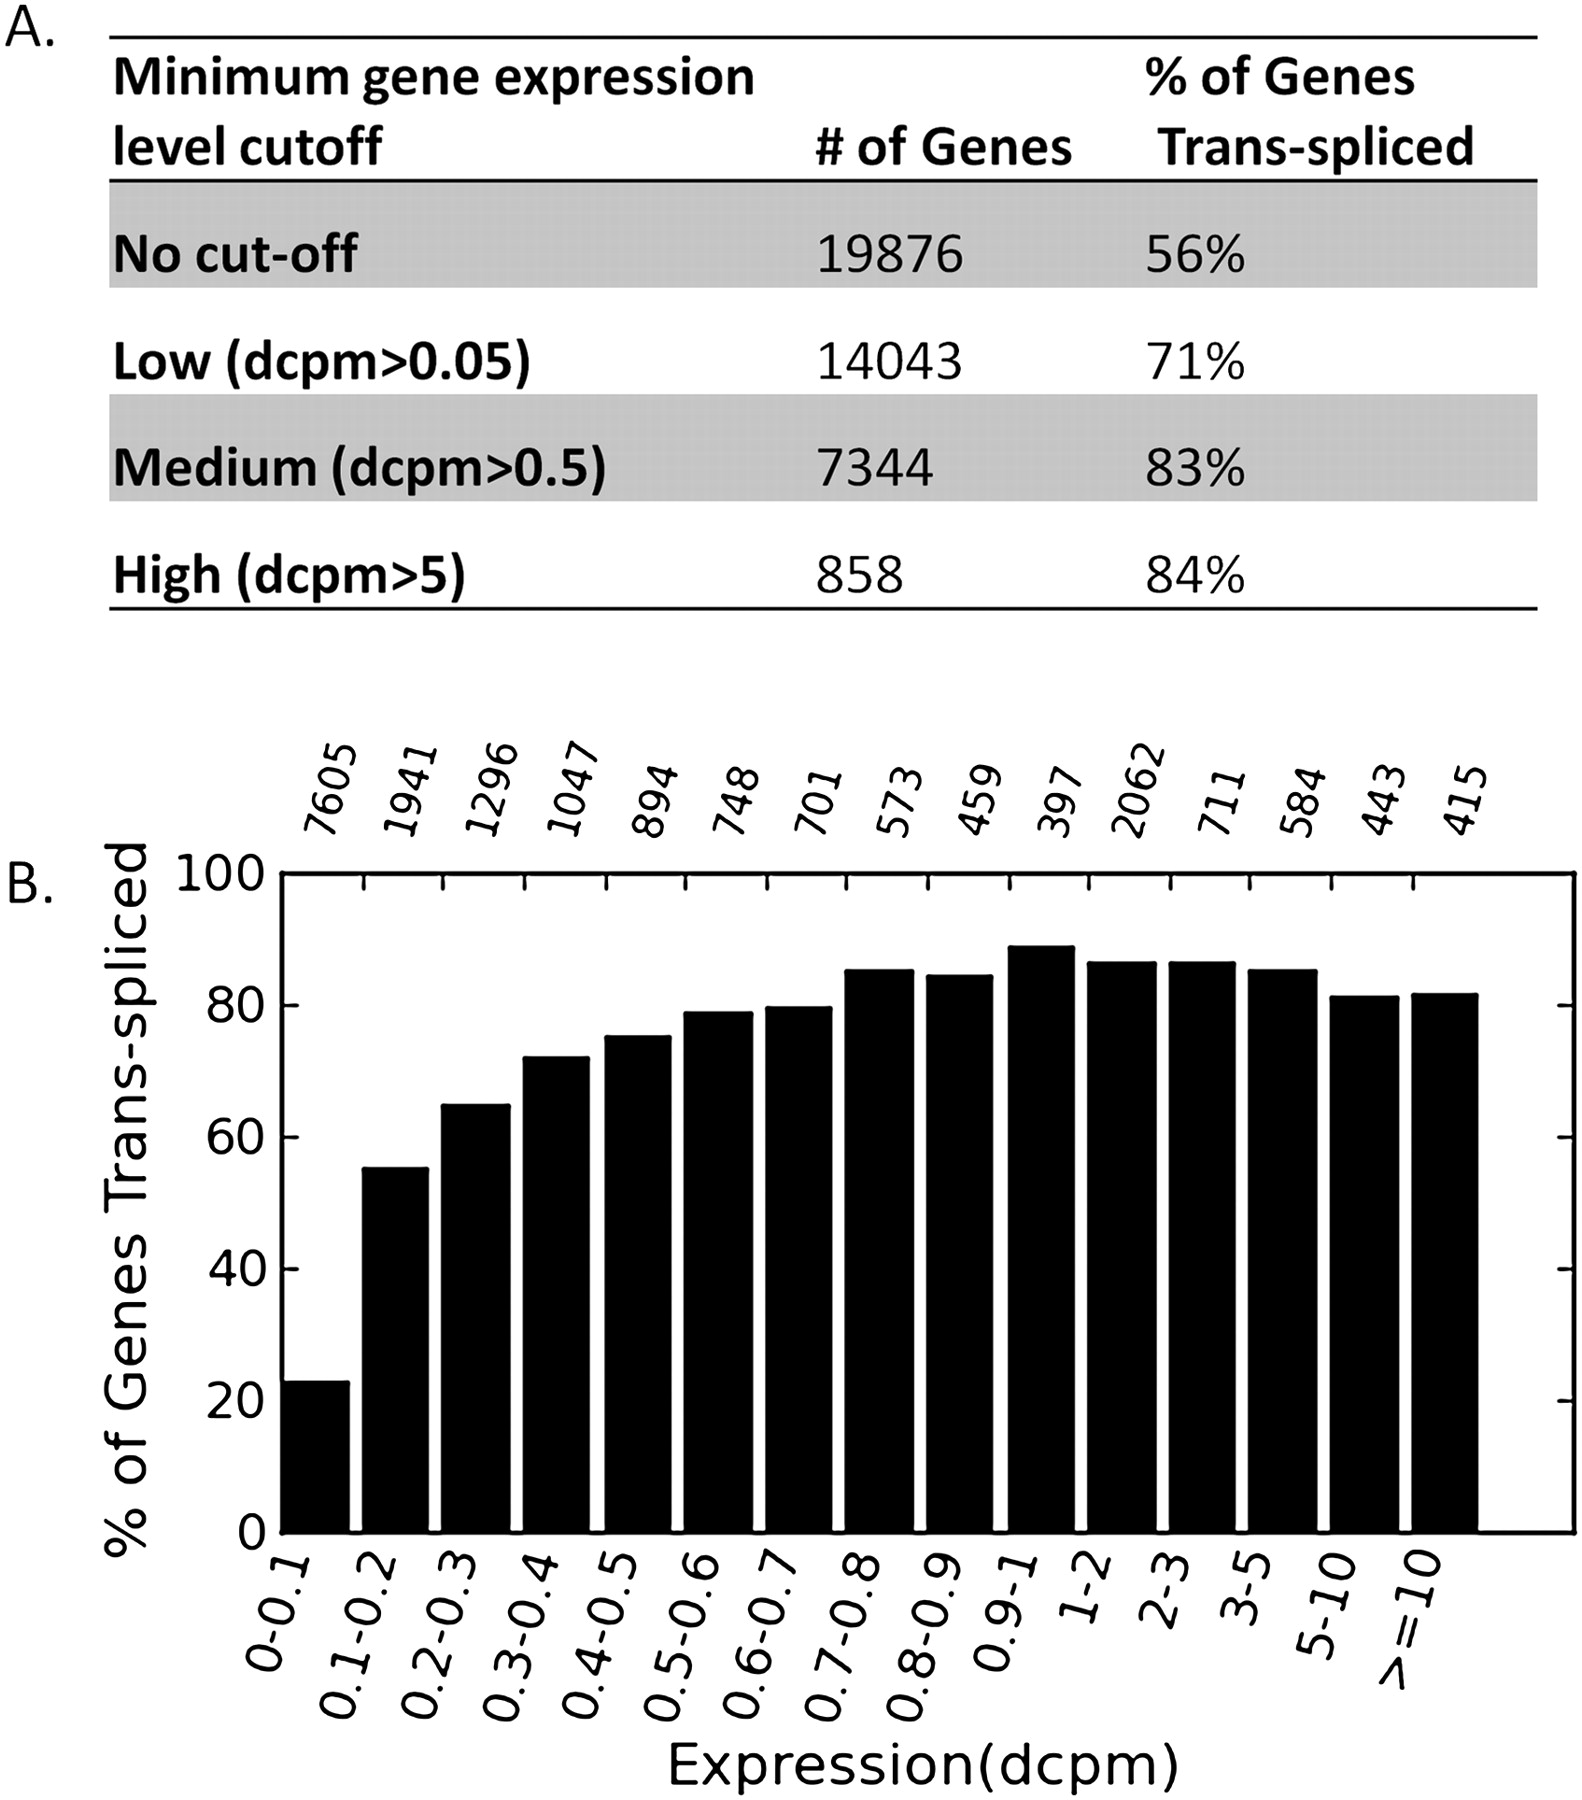
The level of trans-splicing in C. elegans. (A) Trans-splice sites were mapped to the 5′ ends of protein-coding genes. For each gene, average expression across all stages in dcpm was used. To guarantee trans-splicing could have been detected if present, cut-offs were used to remove genes with low expression levels. The first row contains all genes. The lower rows contain genes with expression levels higher than the minimal expression level cutoff. The middle column lists the number of genes above the cutoff, and the last column is the percentage of those genes that are trans-spliced. (B) Genes expressed more highly are more likely to be trans-spliced. Genes were divided into bins based on expression level. For each gene, average expression across all stages in dcpm was used. Percentage of genes in each group that are trans-spliced was plotted. The number above each bar indicates the number of genes in the bin.


