
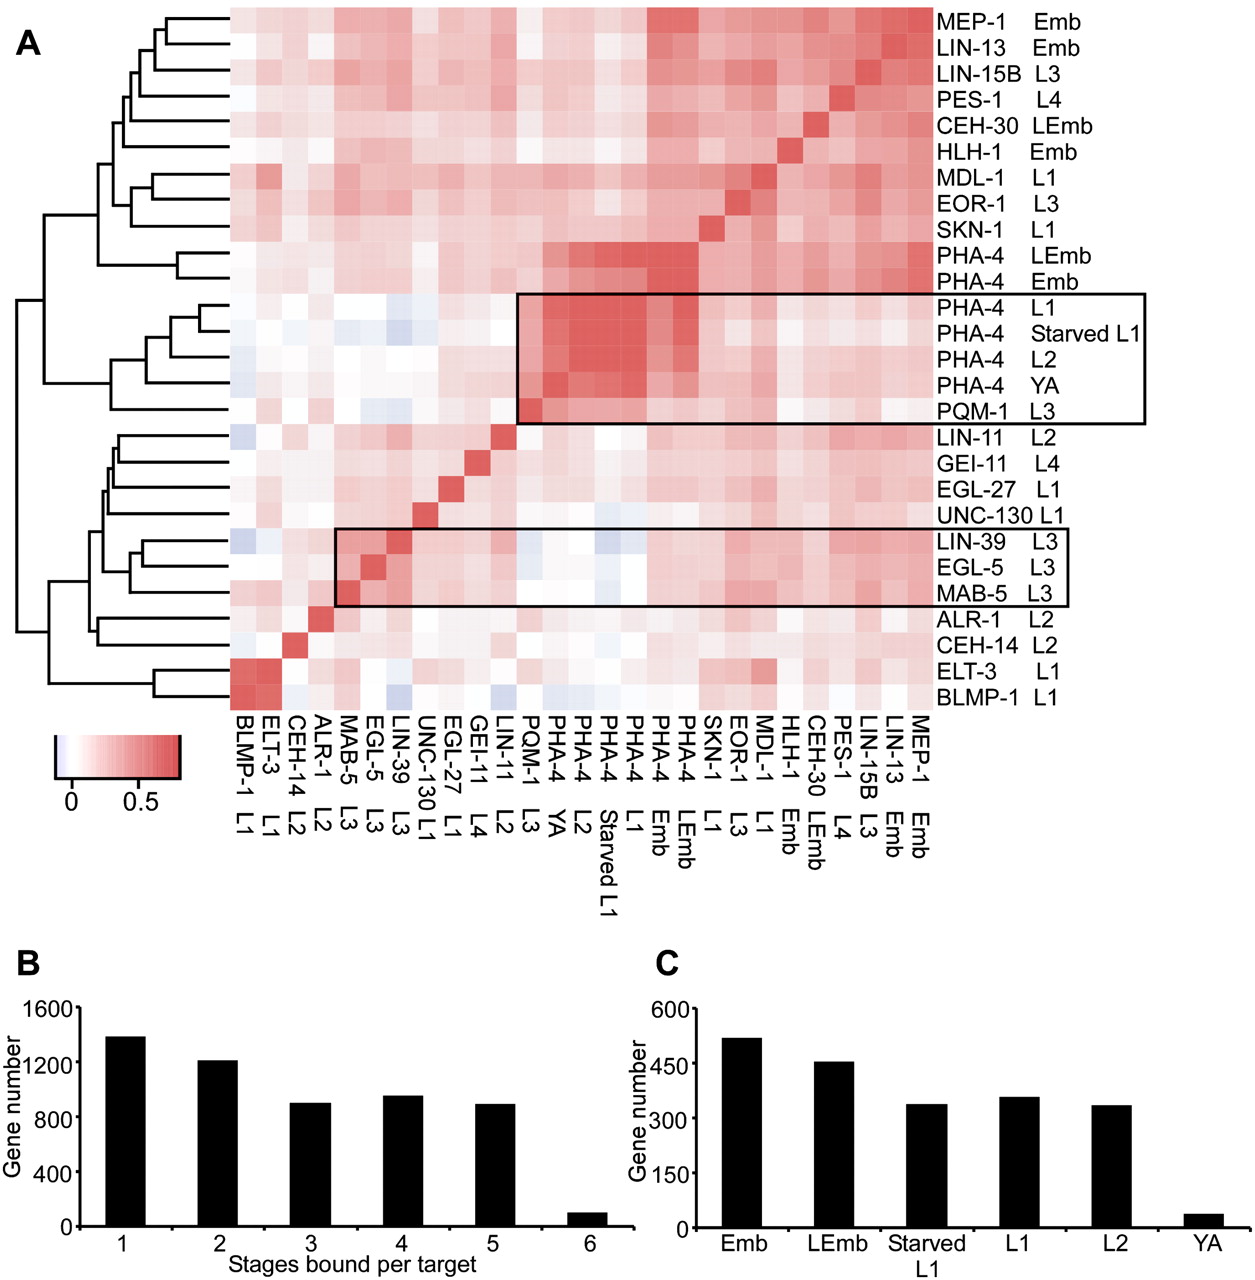
Correlation of target gene binding by the 22 TFs. (A) Peak regions of all 22 factors (without HOT sites) were collected and binned into 100-bp windows. The signal in each bin for each factor was used in pairwise correlations as shown in the heat map. The heat map reflects the co-bound frequency (correlation coefficient) of each pair of TFs, with red indicating more co-bound regions and blue indicating less. TFs have been clustered along both axes based on similarity in their bound regions. (B) A histogram showing the number of genes targeted by PHA-4 at one, two, or more stages of development. (C) A histogram showing the number of unique PHA-4 binding sites at each stage.


