
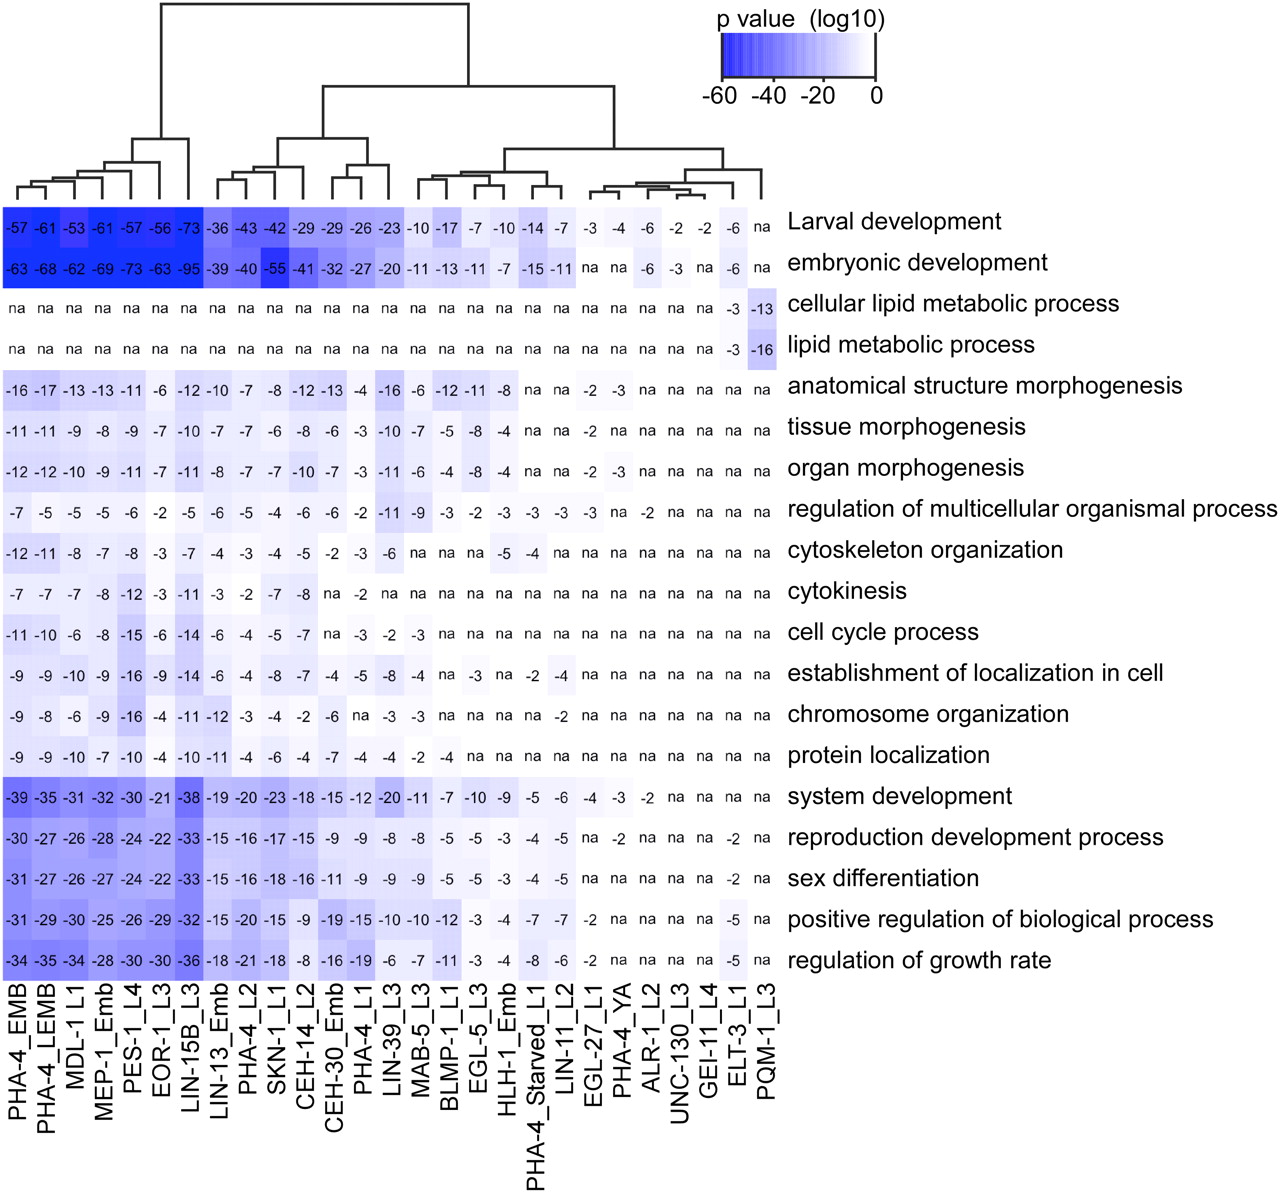
Figure 4.
Correlation of GO categories between factors. The similarity between GO categories for each TF was calculated and organized into a heat map, which was clustered by TF based on this similarity.
(Downloading may take up to 30 seconds. If the slide opens in your browser, select File -> Save As to save it.)
Click on image to view larger version.
Correlation of GO categories between factors. The similarity between GO categories for each TF was calculated and organized into a heat map, which was clustered by TF based on this similarity.
 CiteULike
 Delicious
 Digg
Digg Facebook
 Google+
 Reddit
 Twitter
