
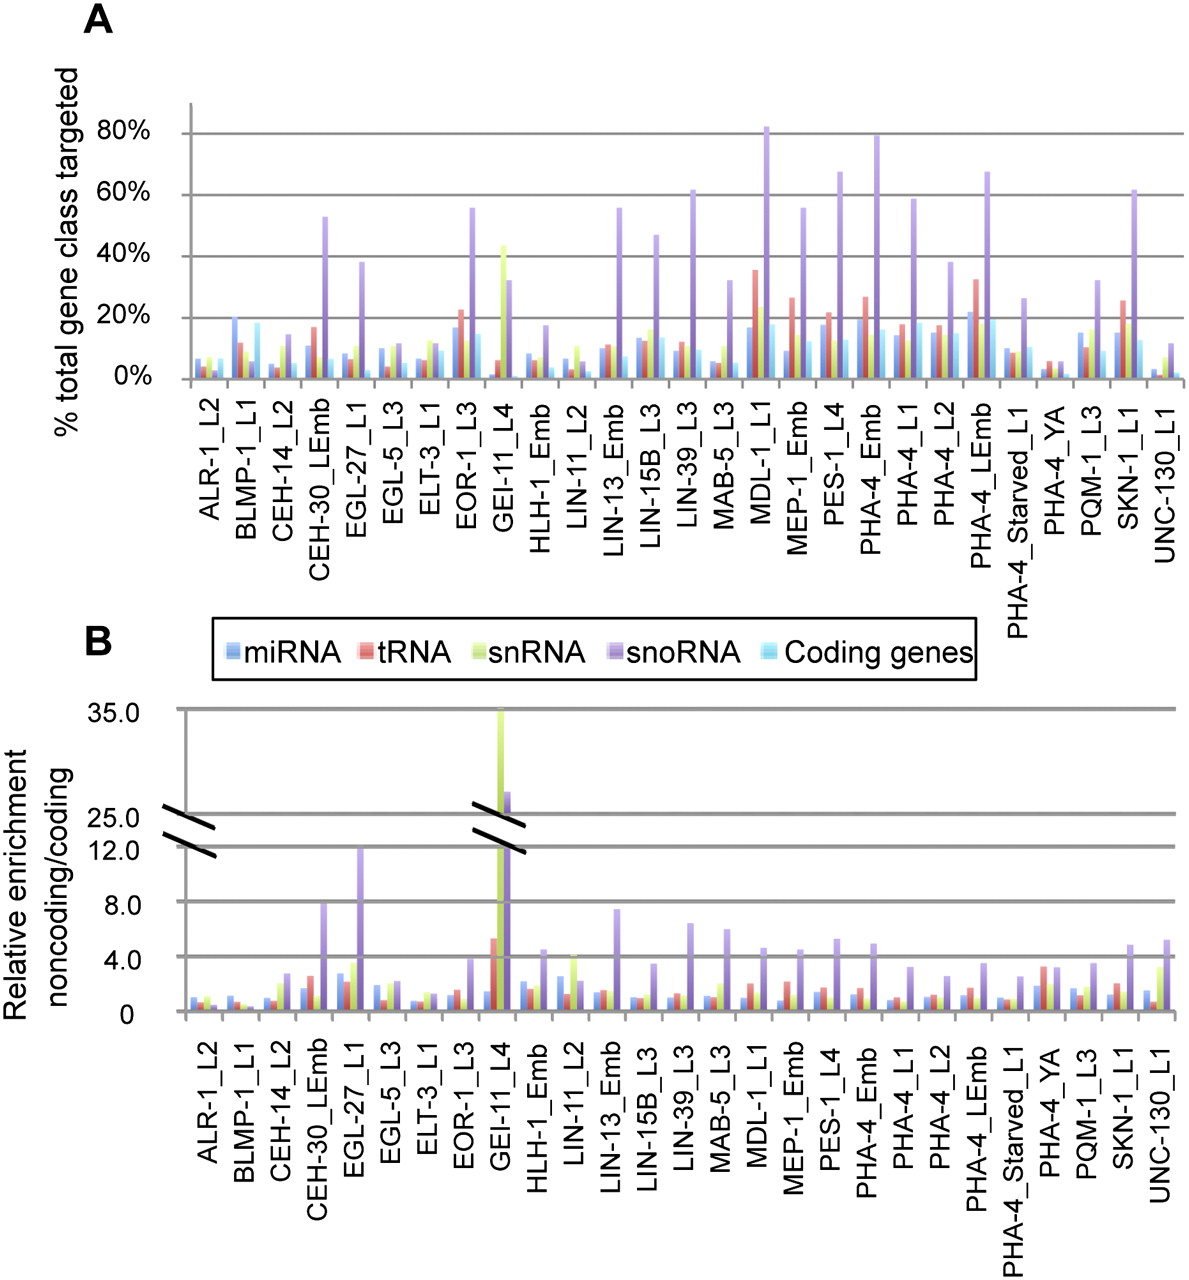
Figure 3.
Non-coding RNA genes are frequent targets of TFs. (A) Chart showing the fraction of each gene class (miRNA, snoRNA, snRNA, tRNA, and coding) bound by each TF. (B) Chart showing the relative enrichment of the fraction of each non-coding class bound by each TF relative to the fraction of coding genes bound by that TF.


