
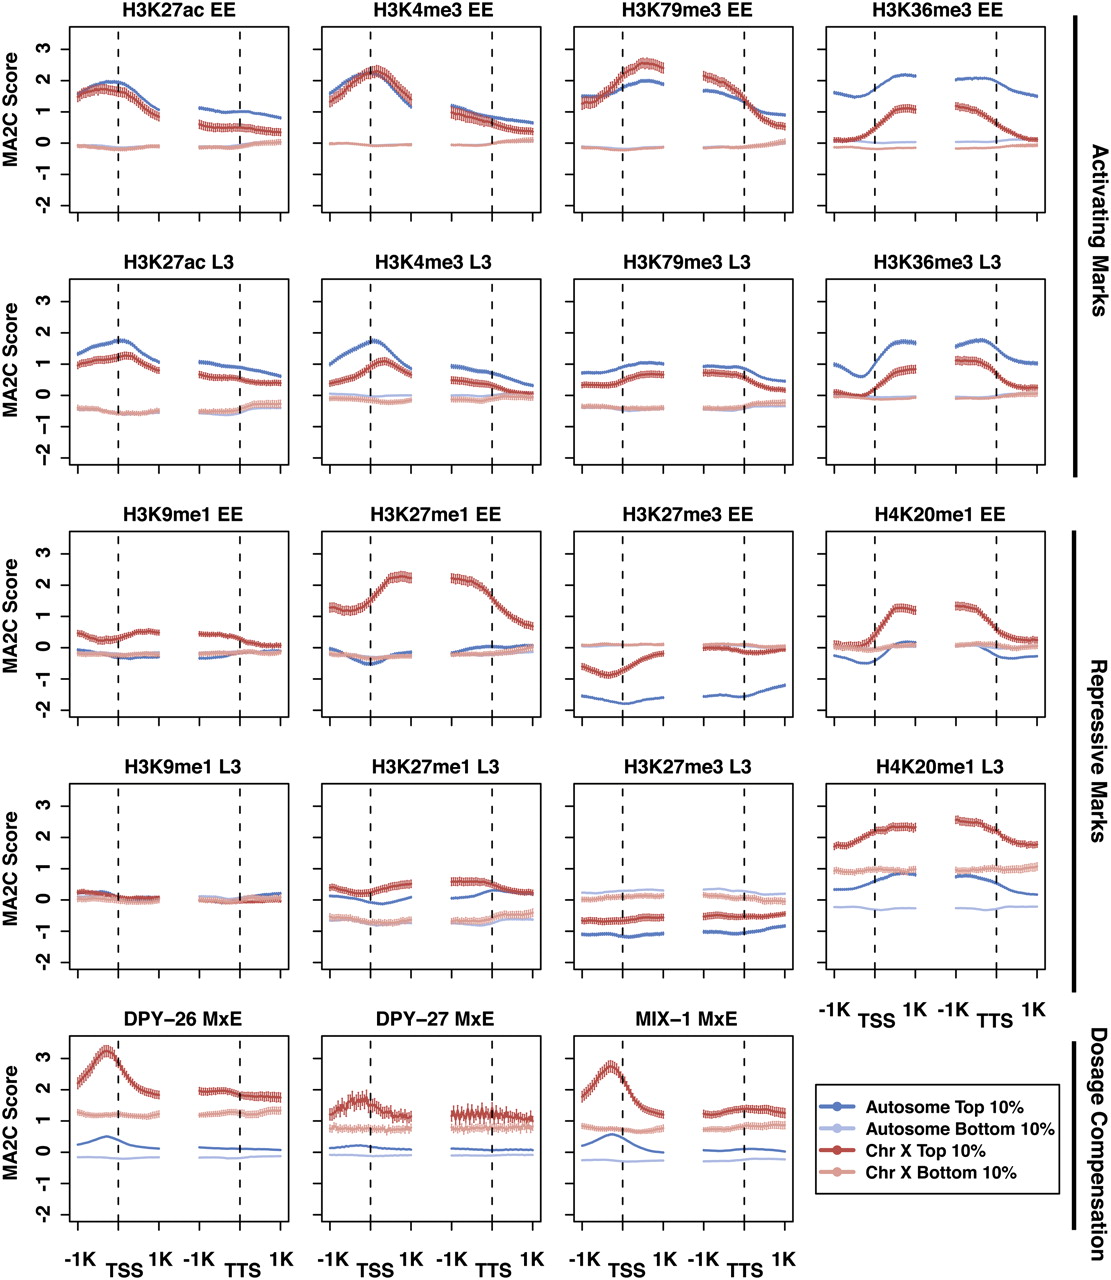
Figure 4.
Profiles of factors on X-linked and autosomal genes in the top and bottom expression bins. Average signal profiles in the 2 kb around transcript start sites (TSS) and transcript termination sites (TTS) are shown for selected factors (see Supplemental Fig. S2 for complete set) on four groups of genes: autosomal genes in the top 10% and bottom 10% of expression and X-linked genes in the top 10% and bottom 10% of expression. The top two rows are marks associated with active gene expression; the next two rows are marks associated with repression; the bottom row is components involved in dosage compensation.


