
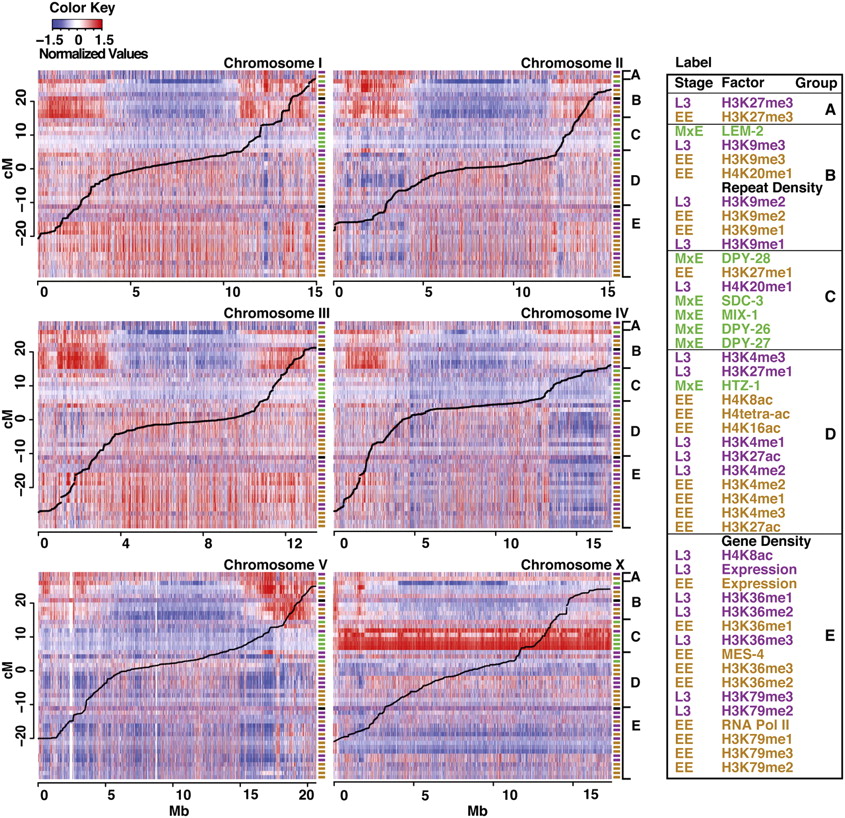
Figure 2.
Histone marks and chromatin proteins show distinct patterns on different chromosomes and on the arms versus central region of each chromosome. The signal intensity of all analyzed factors is shown across all six chromosomes. Colored cells show median signals in 1-kb windows: (red) high signal, (blue) low signal. Each row corresponds to a factor. The order of factors is as shown in Figure 1 and in the key to the right. The colored labels to the right of each track indicate stage, as in Figure 1. (Thick black lines) Marey plots of recombination distances. Enlarged views of each chromosome are in Supplemental Figure S3.


