
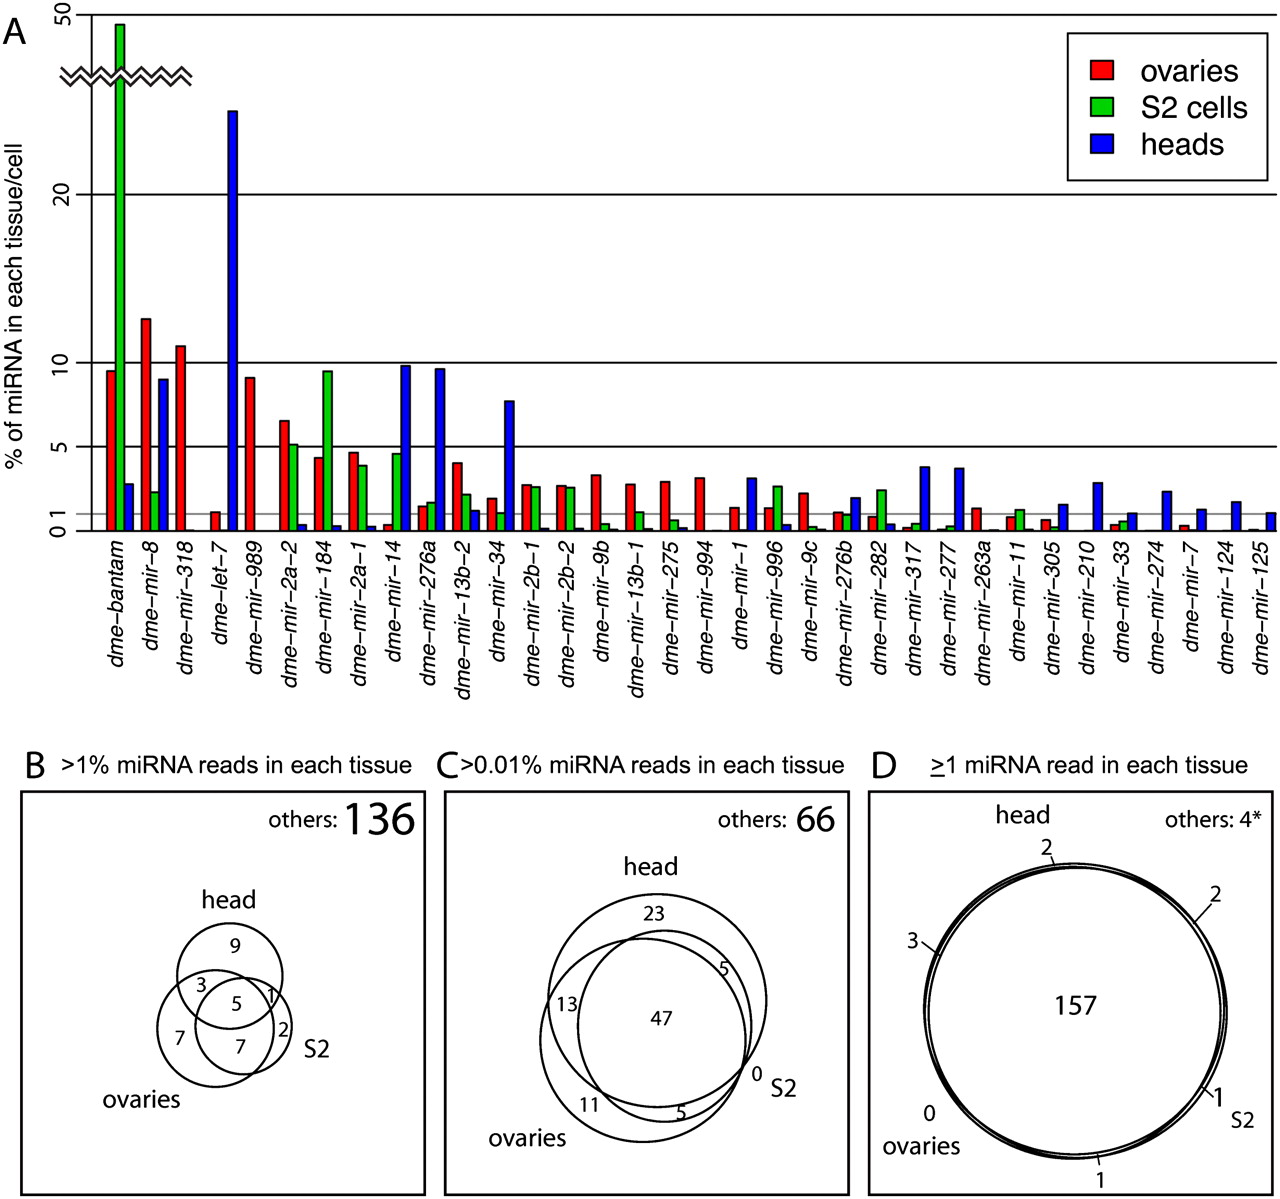
Distinct and overlapping patterns of miRNA expression in different tissues and samples. (A) Graph shows those miRNAs that contribute more than 1% of miRNAs in aggregated sets of ovary, head, and S2 cell data totaling about 30–70 M reads specifically mapped to miRNAs. It is clear that many miRNAs are either strongly enriched or seemingly absent from one of the three sample types. (B–D) Venn diagrams that show the overlap in miRNAs detected in ovary, head, and S2 cells at various levels of expression. As the contribution of each miRNA decreases from 1% (B) to >0.01% (C), we observe increasing coexpression among these distinct tissue/cell types. When considering miRNA expression down to a single read in each library, we observe nearly complete coexpression. The few miRNAs that were not detected (4*) are either questionable as canonical miRNAs (miR-280 and miR-289) or were detected at only a few parts per million in the esoteric cell line OSS (miR-2280 and miR-2281).


