
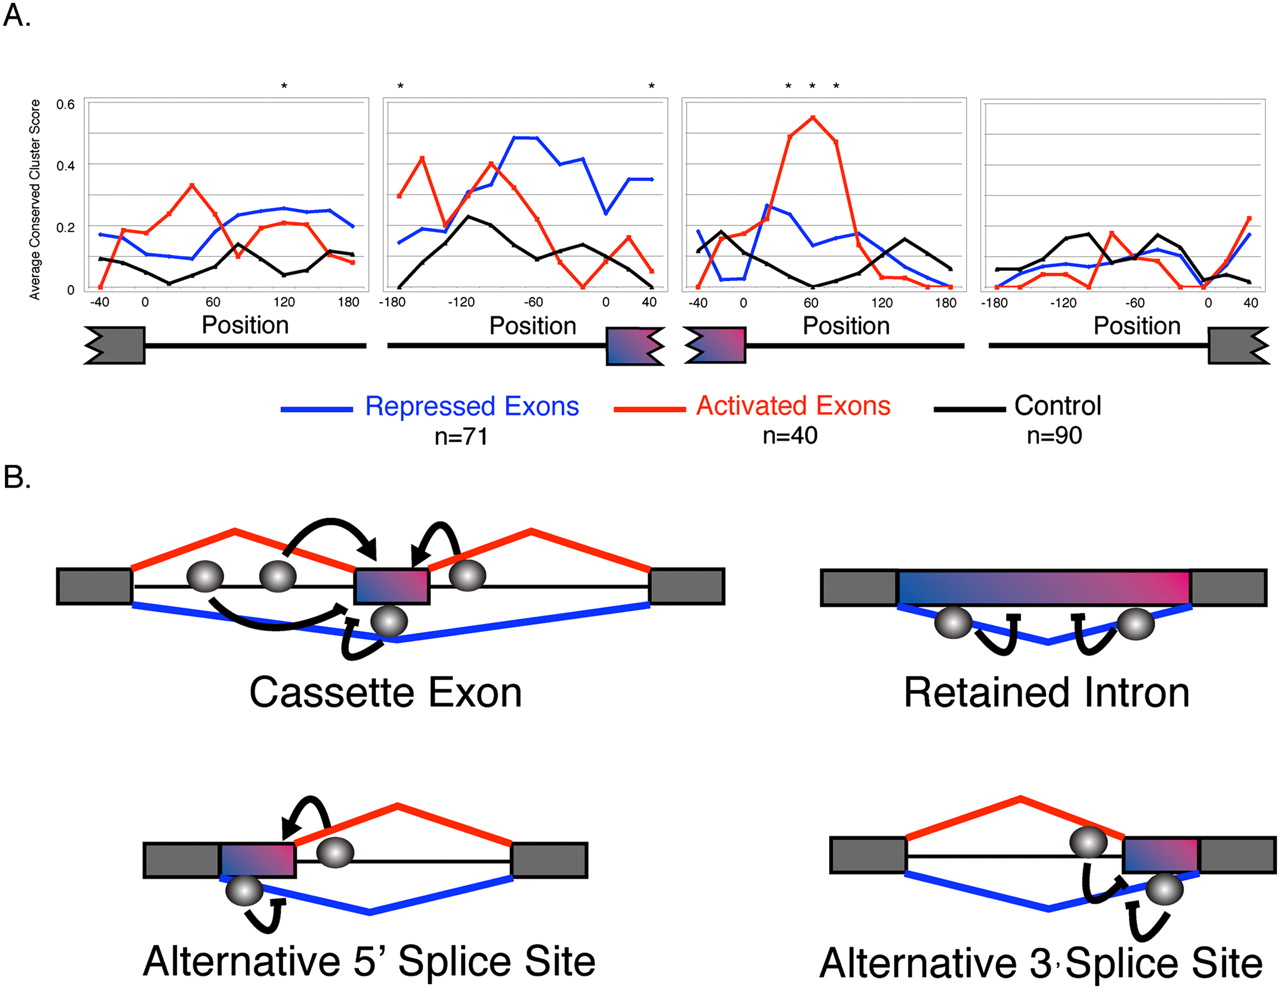
A Pasilla RNA-map. (A) Each position in the graph represents the average conserved YCAY cluster score, within a centered sequence window of 45 nt. The conserved YCAY cluster score was calculated for cassette exons that are activated by PS, repressed by PS, and unaffected cassette exons (Fisher's exact test, Benjamini-Hochberg adjusted P-value ≥ 0.95). Only regions adjacent to introns >400 nt were used for scoring. Positions with enriched YCAY cluster scores are indicated by an asterisk (Wilcoxon-rank sum test, uncorrected P-value < 0.01). (B) Positions near cassette exon events, alternative 5′ splice site events, alternative 3′ splice site events, and retained intron events with an enrichment of YCAY clusters. Gray spheres indicate the relative positions containing enriched binding sites. Detailed plots of average conserved YCAY cluster scores are shown in Supplemental Figure 9.


