
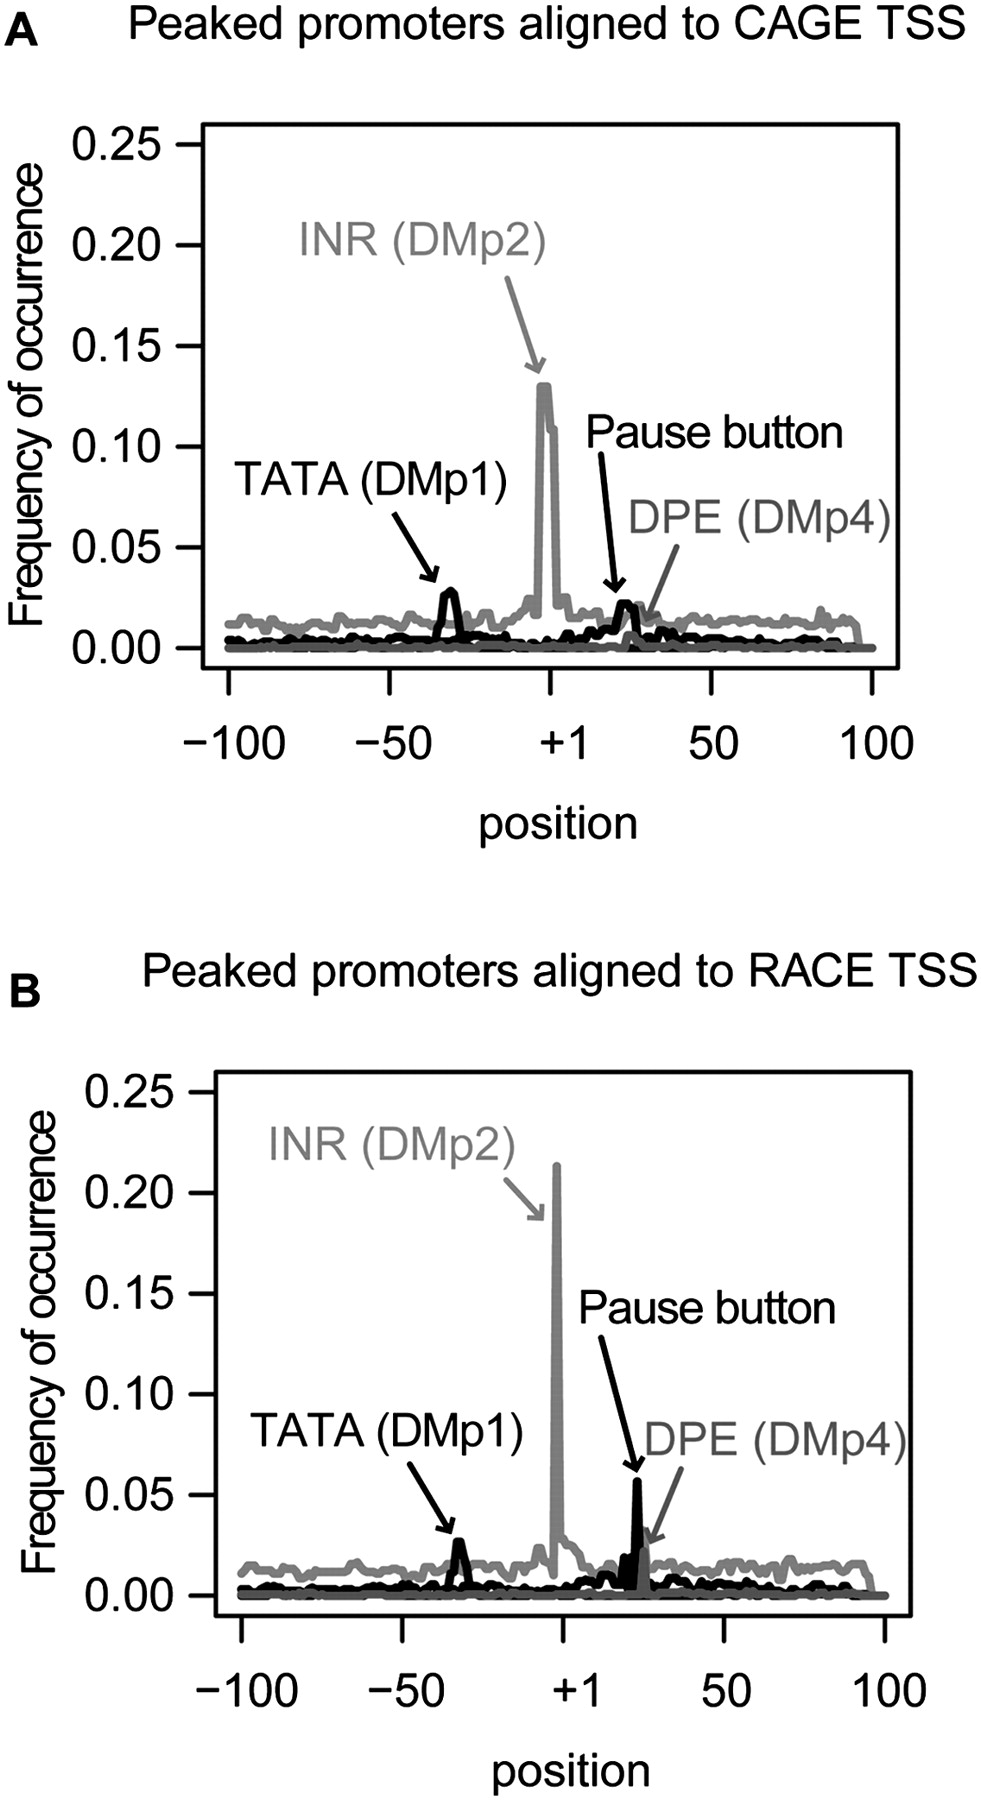
Figure 6.
Comparison of the CAGE and RACE assays by motif analysis in peaked promoters. Motif occurrence frequencies of positionally enriched motifs are plotted. The most abundant TSS within a promoter was used to define position +1. (A) Motif positions in peaked promoters relative to the most abundant TSS defined by CAGE. (B) Motif positions in peaked promoters relative to the most abundant TSS defined by RACE.


