
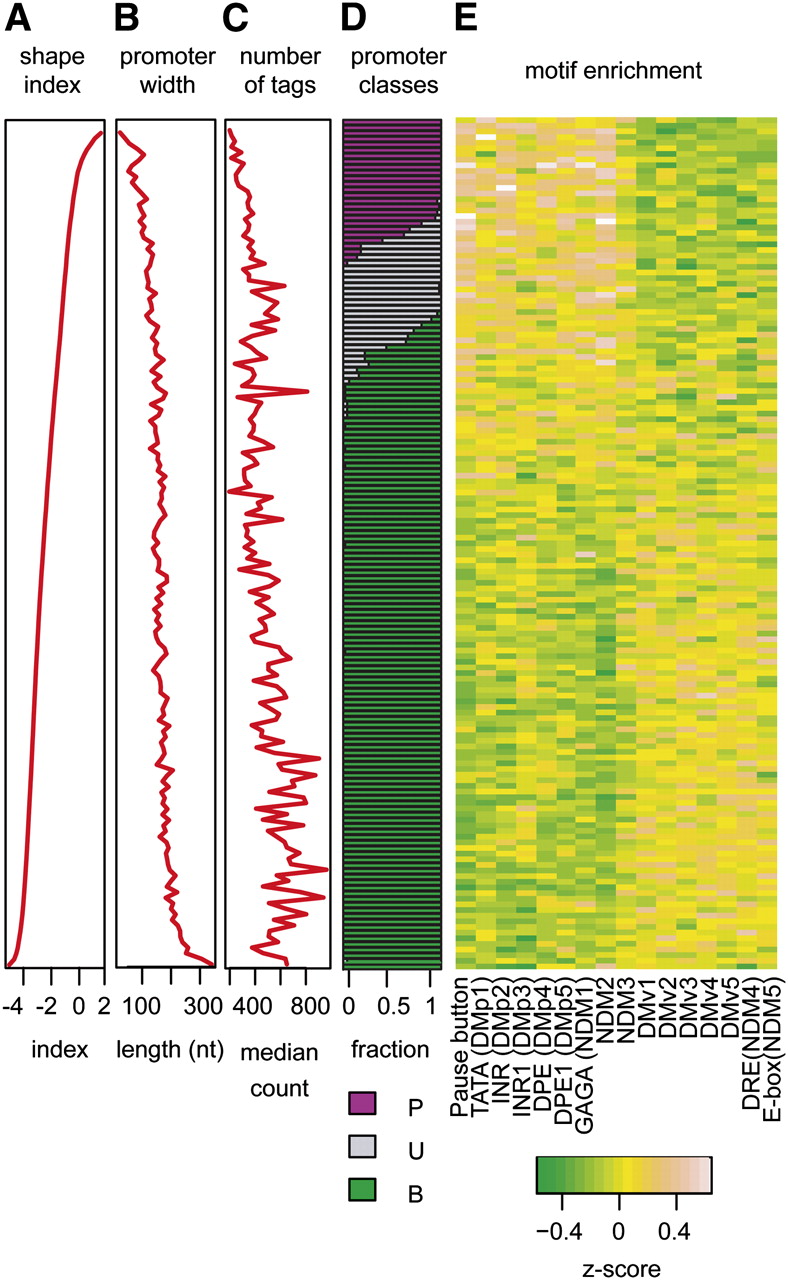
Figure 5.
Promoter architecture of the Drosophila embryo. Promoters are ordered by shape index, and each row corresponds to the average of a bin of 50 promoters. Shape index (A), promoter width (B), and number of tags per promoter (C) are plotted. (D) Promoter classification into peaked (P, purple), unclassified (U, gray), and broad (B, green) are indicated. (E) Core promoter motifs are differentially enriched between peaked and broad promoters.


