
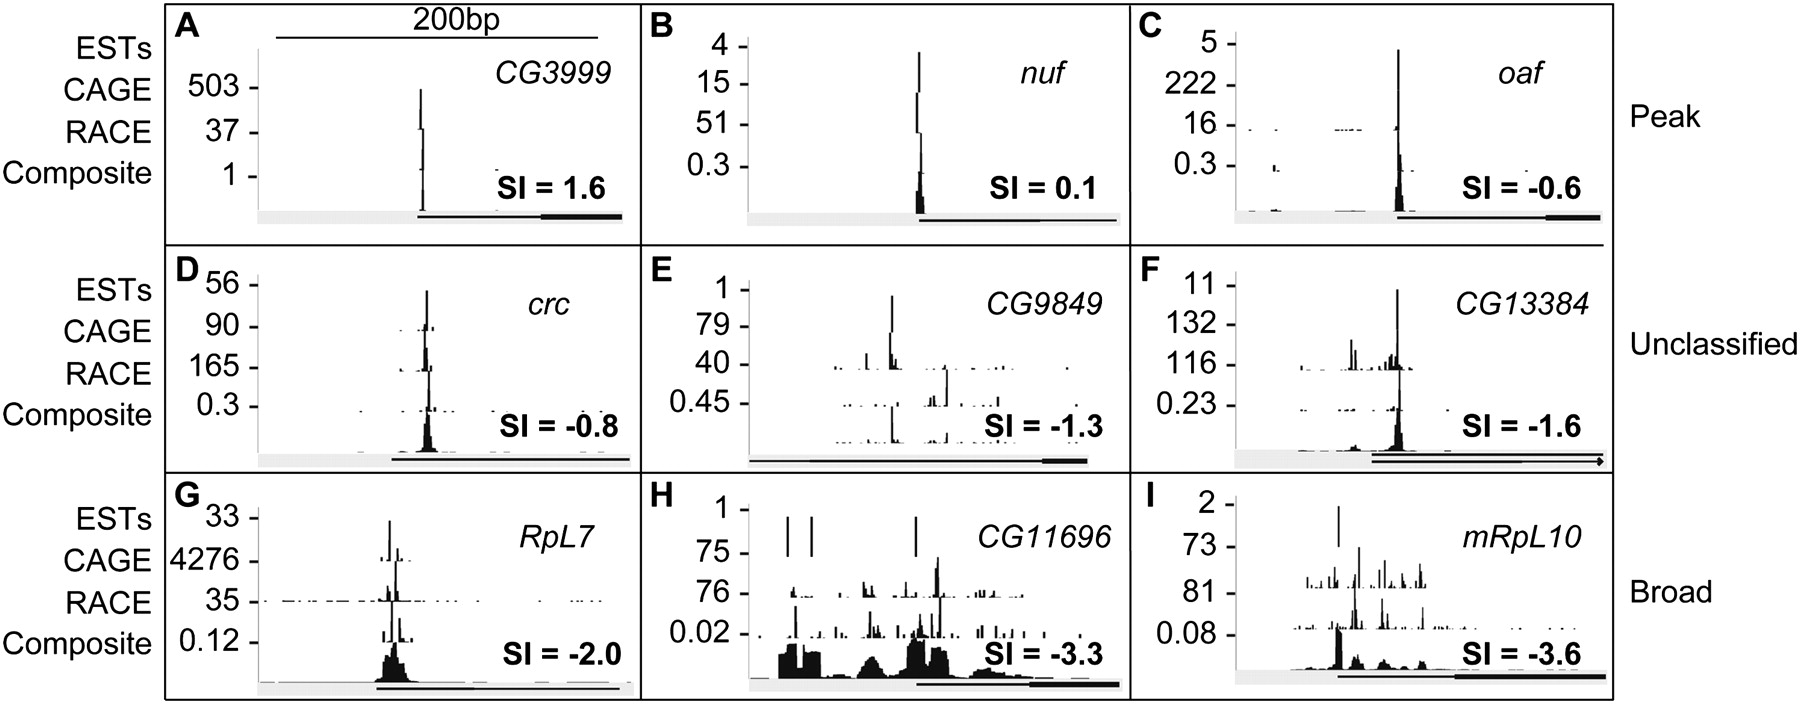
Figure 3.
Integration of RE EST, CAGE, and RACE data and classification of promoter shape. TSS distributions within nine promoter regions are ordered by increasing shape index (SI): (A–C) peaked promoters, (D–F) unclassified promoters, and (G–I) broad promoters. For each promoter, the RE EST, CAGE, RACE, and composite TSS distributions are shown. SI values of the composite distributions and gene associations are indicated.


