
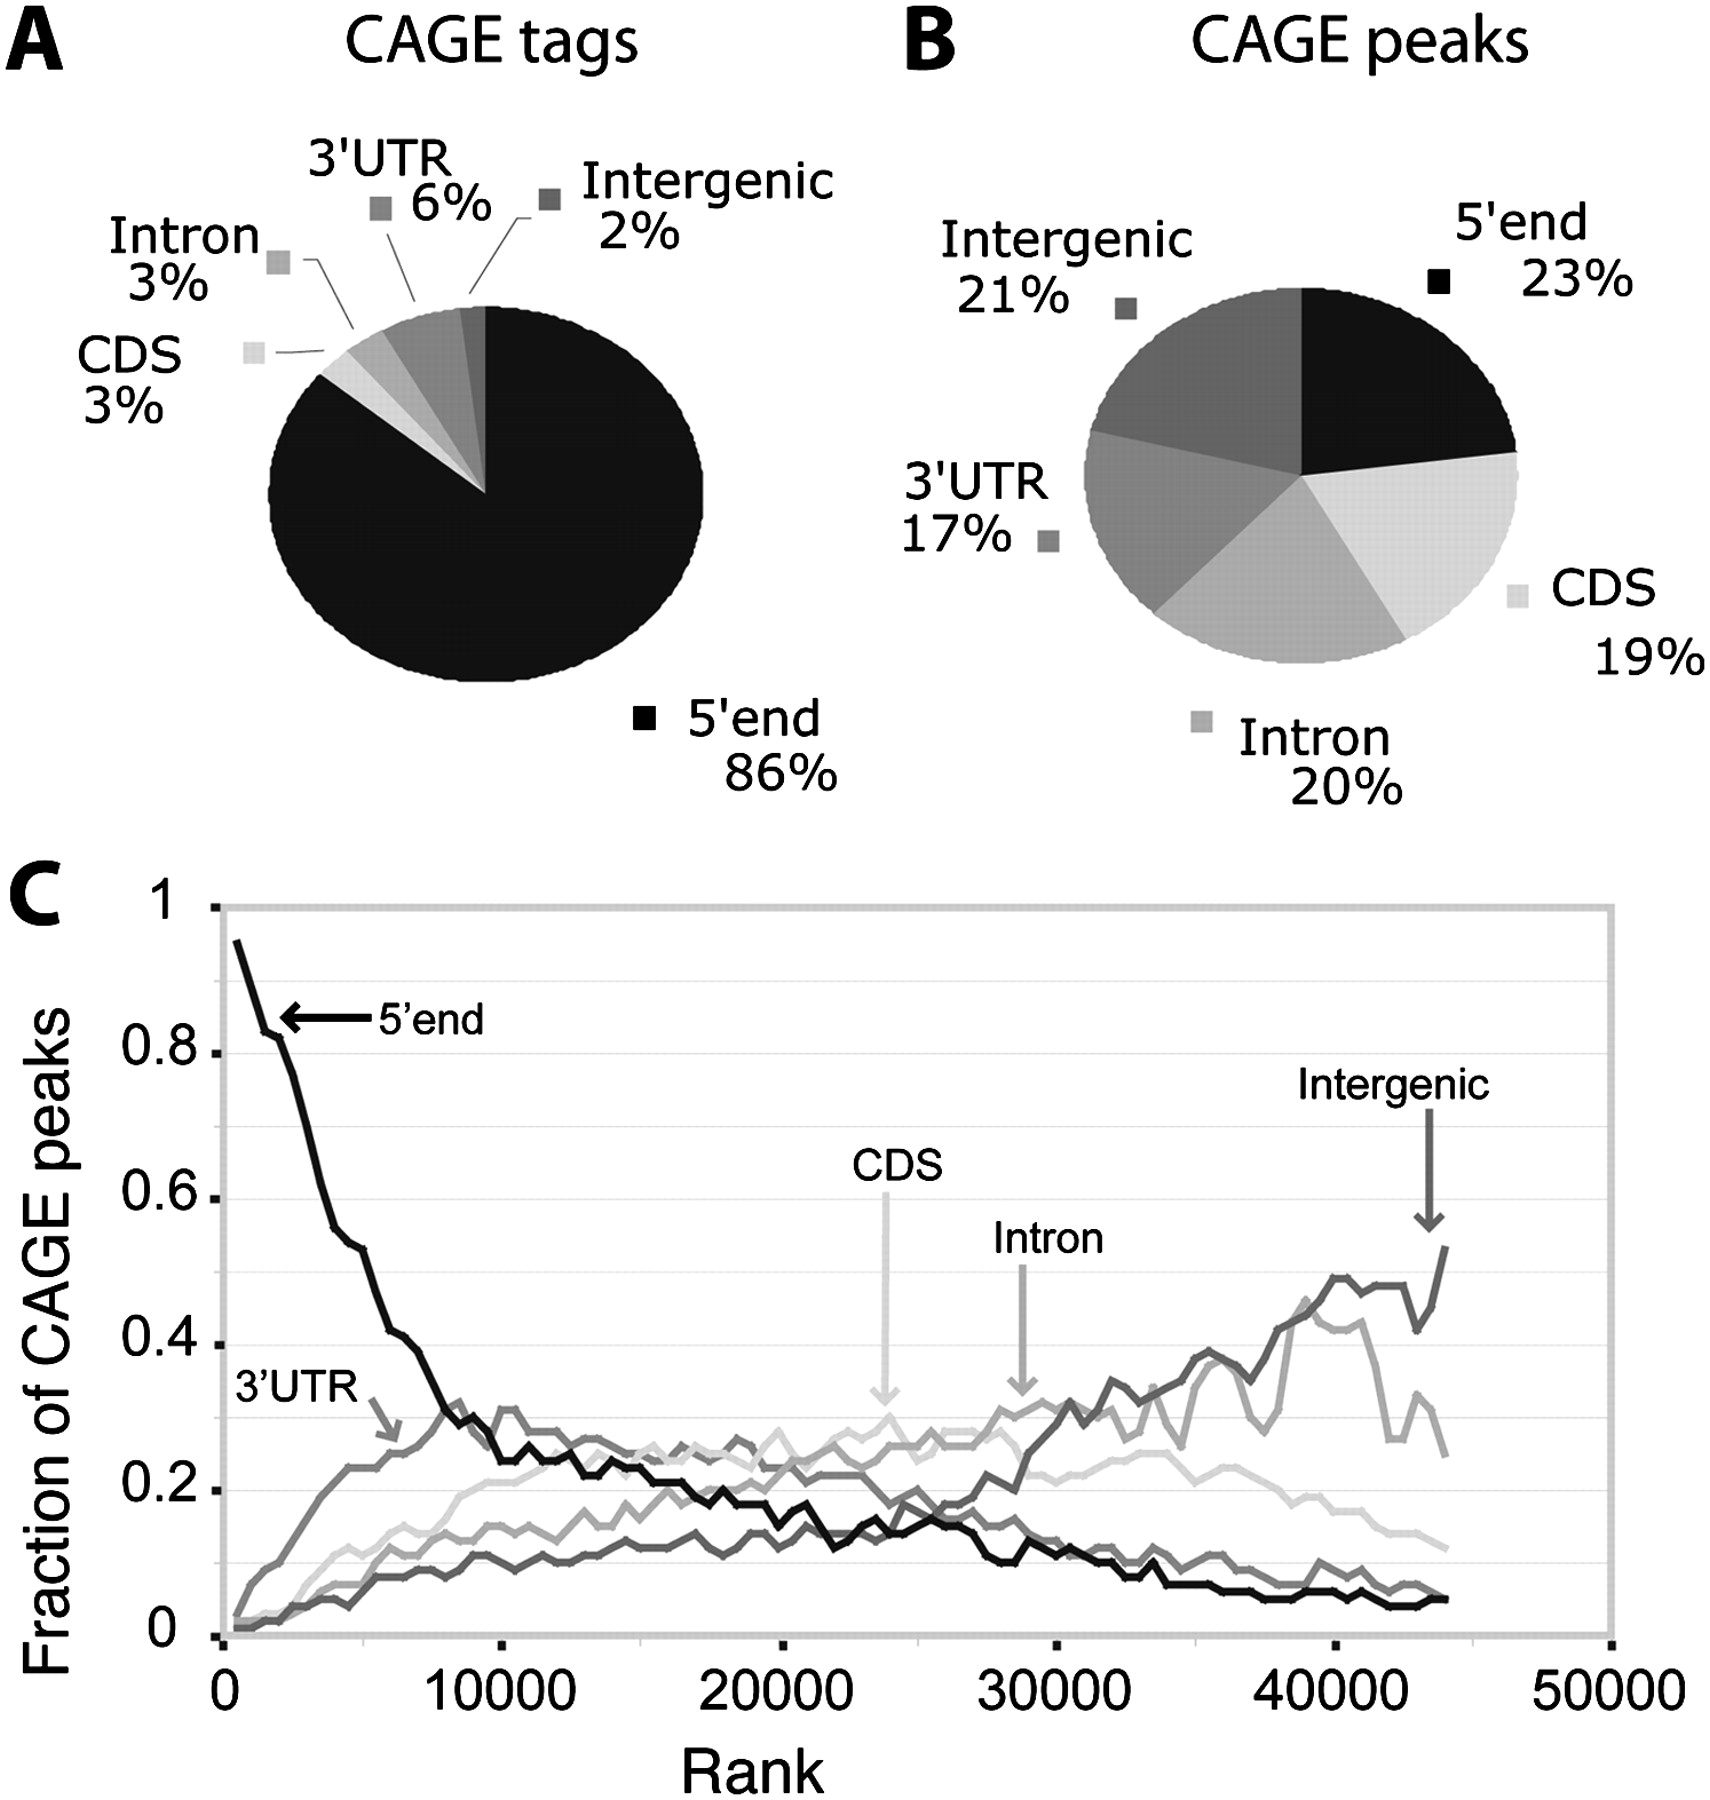
Figure 1.
Intersection of CAGE data with gene annotations. (A) The fractions of total CAGE tags that overlap annotated features. (B) The fractions of CAGE peaks that overlap annotated features. (C) CAGE peaks are ordered by tag count from highest to lowest. For bins of 1000 CAGE peaks, the fractions of peaks that overlap five classes of annotated features are plotted. The CAGE peaks toward the top of the rank list primarily overlap 5′ UTRs, while peaks at the bottom of the rank list tend to be intergenic. At the bottom of the rank list, the fractions of overlap approach expectation as computed by the GSC statistics package.


