
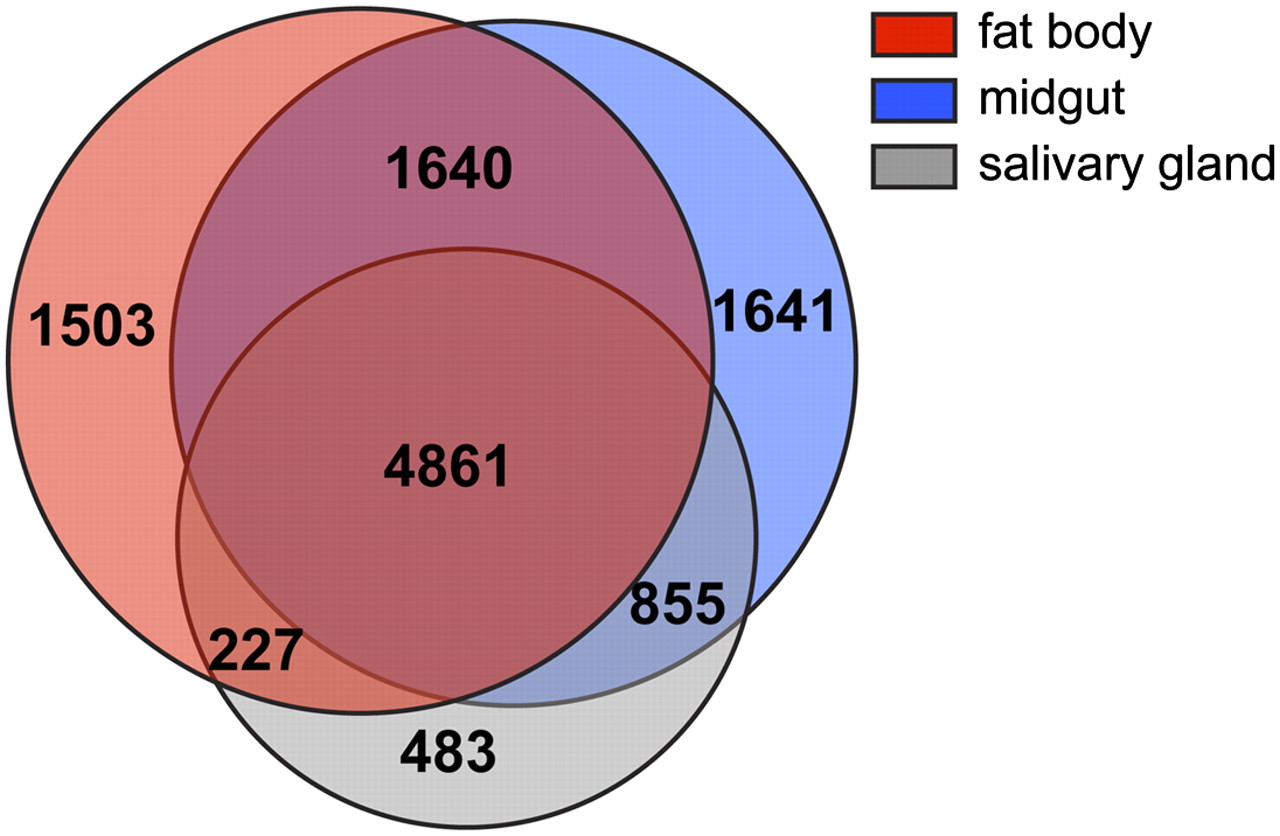
Figure 5.
Tissue specificity of transcripts. Diagram illustrates the number of transcripts common to each tissue or the number of transcripts whose expression is shared between tissues.
(Downloading may take up to 30 seconds. If the slide opens in your browser, select File -> Save As to save it.)
Click on image to view larger version.
Tissue specificity of transcripts. Diagram illustrates the number of transcripts common to each tissue or the number of transcripts whose expression is shared between tissues.
 CiteULike
 Delicious
 Digg
Digg Facebook
 Google+
 Reddit
 Twitter
