
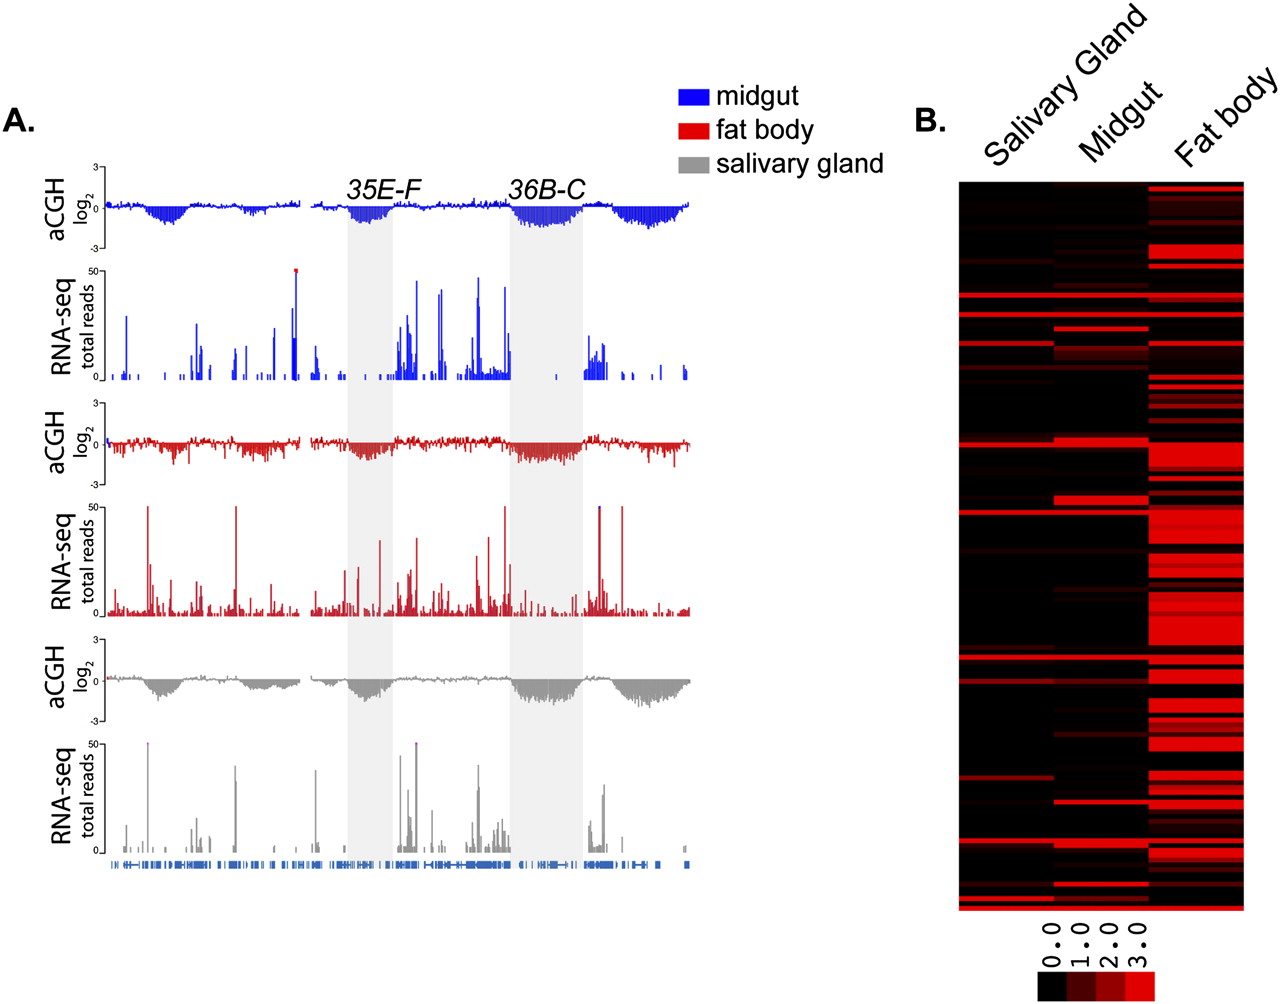
Tissue-specific differences in transcription across common underreplicated genomic loci. (A) aCGH profiles of copy number differences and RNA-seq showing the level of transcription within those regions. Sites of common underreplication are highlighted. RNA-seq data for the salivary gland was obtained from modENCODE (N Sher, S Li, G Bell, T Eng, M Eaton, D MacAlpine, and TL Orr-Weaver, in prep.) (chr2L:14,500,000–18,000,000). (B) A heat map of the 151 transcripts within the 11 common regions of underreplication shows that many transcripts are expressed in larval fat body relative to larval salivary gland or larval midgut tissues (generated with Cluster/TreeView) (Eisen et al. 1998). Each row represents a transcript and each column represents a tissue type. Only RPKM values of ≥3, represented as dark red, are considered expressed. The raw data used in the heat map can be found in Supplemental Table 1.


