
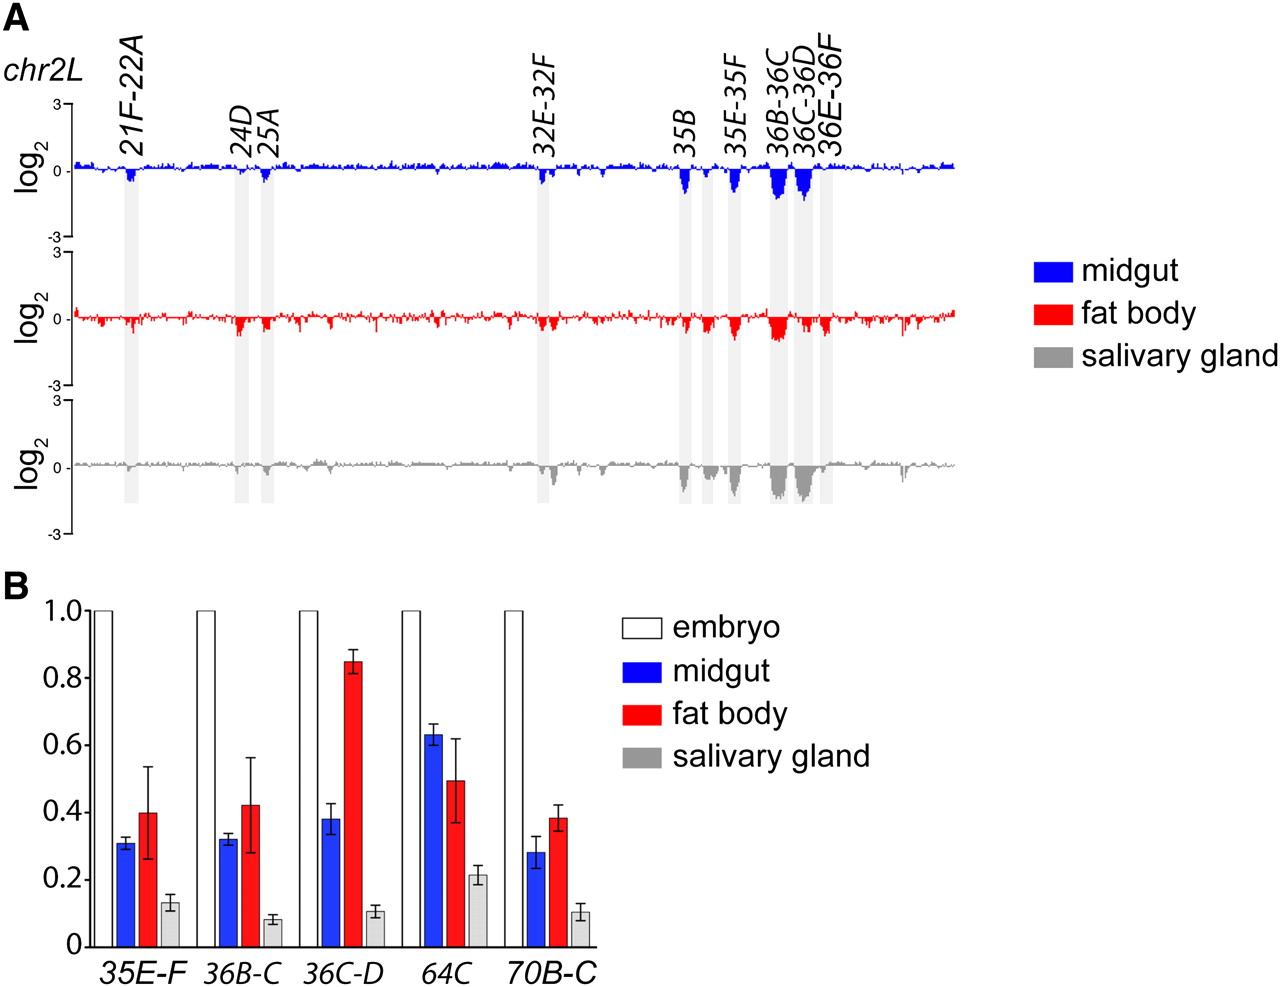
Tissue specificity of underreplication in polytene tissues. (A) Array based comparative genomic hybridization (aCGH) profiles of the left arm of chromosome 2 (chr2L:1–21,400,000) are shown. Cy-labeled DNA samples obtained from larval midgut or fat body tissues are compared with embryonic control DNA. Sites of underreplication common to all tissue types and tissue-specific differences in underreplication are highlighted. Only one of two biological replicates is shown. The profile of larval salivary glands was generated using data from N Sher, S Li, G Bell, T Eng, M Eaton, D MacAlpine, and TL Orr-Weaver (in prep.). (B) Quantitiative real-time PCR analysis of five sites of underreplication confirms the level and tissue-specific differences of underreplication as seen by aCGH.


