
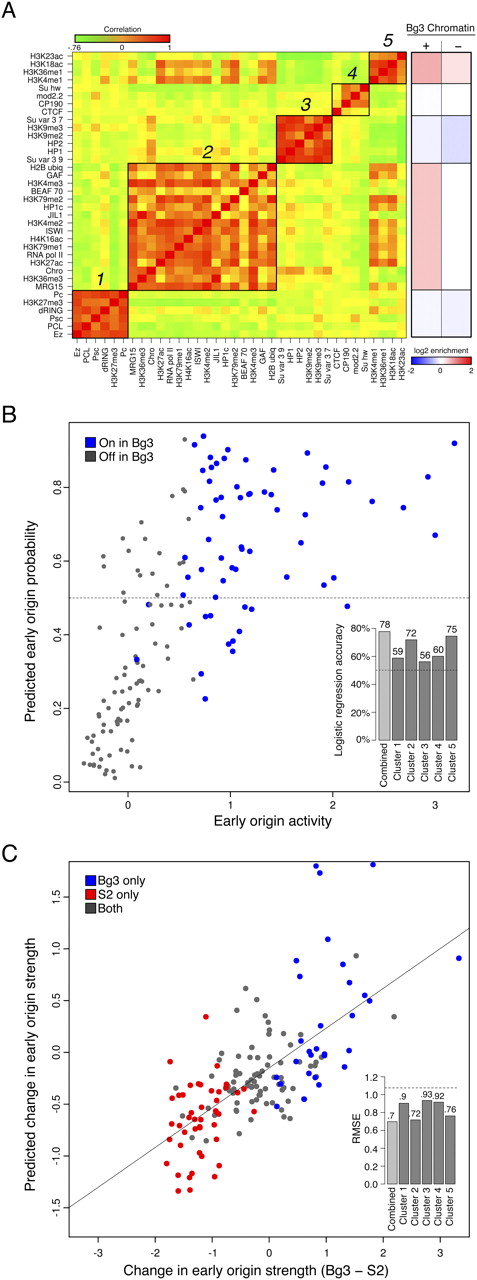
Chromatin signatures are predictive of early origin activity. (A) Subsets of factors are highly correlated at early origins. (Left heatmap) The pairwise correlation between every factor based on their mean signal at early origin meta-peaks in Bg3 cells was computed (where green indicates a negative correlation and red indicates a positive correlation, with values ranging from −0.76 to 1). Five groups of correlated marks were identified by hierarchical clustering. (Right heatmap) The mean enrichment of each cluster in Bg3 active (+) and Bg3 inactive (−) early origin meta-peaks. (B) Classification of Bg3 early origin usage from the full set of early origin meta-peaks by logistic regression. A logistic regression model using the average chromatin scores of each of the five clusters in Bg3 cells is able to classify (above and below the 0.5 horizontal dashed line as true and false, respectively) with 78% accuracy those meta-peaks that are used in Bg3 on chromosome 3R (blue) and those that are not (gray). (Inset) Predictive power for each cluster individually and the ensemble model. (C) Predicting relative origin strength between Bg3 and S2 cells by linear regression. A linear regression using the change in strength of the chromatin signal from five clusters between Bg3 and S2 is able to predict the change in strength of the early origin meta-peaks between the two cell lines. Predicted change in early origin strength between Bg3 and S2 is plotted as function of actual change. Early origins active in S2 (red) or Bg3 (blue) are indicated. The Pearson correlation is ∼0.7. (Inset) The RMSE over random (horizontal dashed line) for each cluster individually and the ensemble model.


