
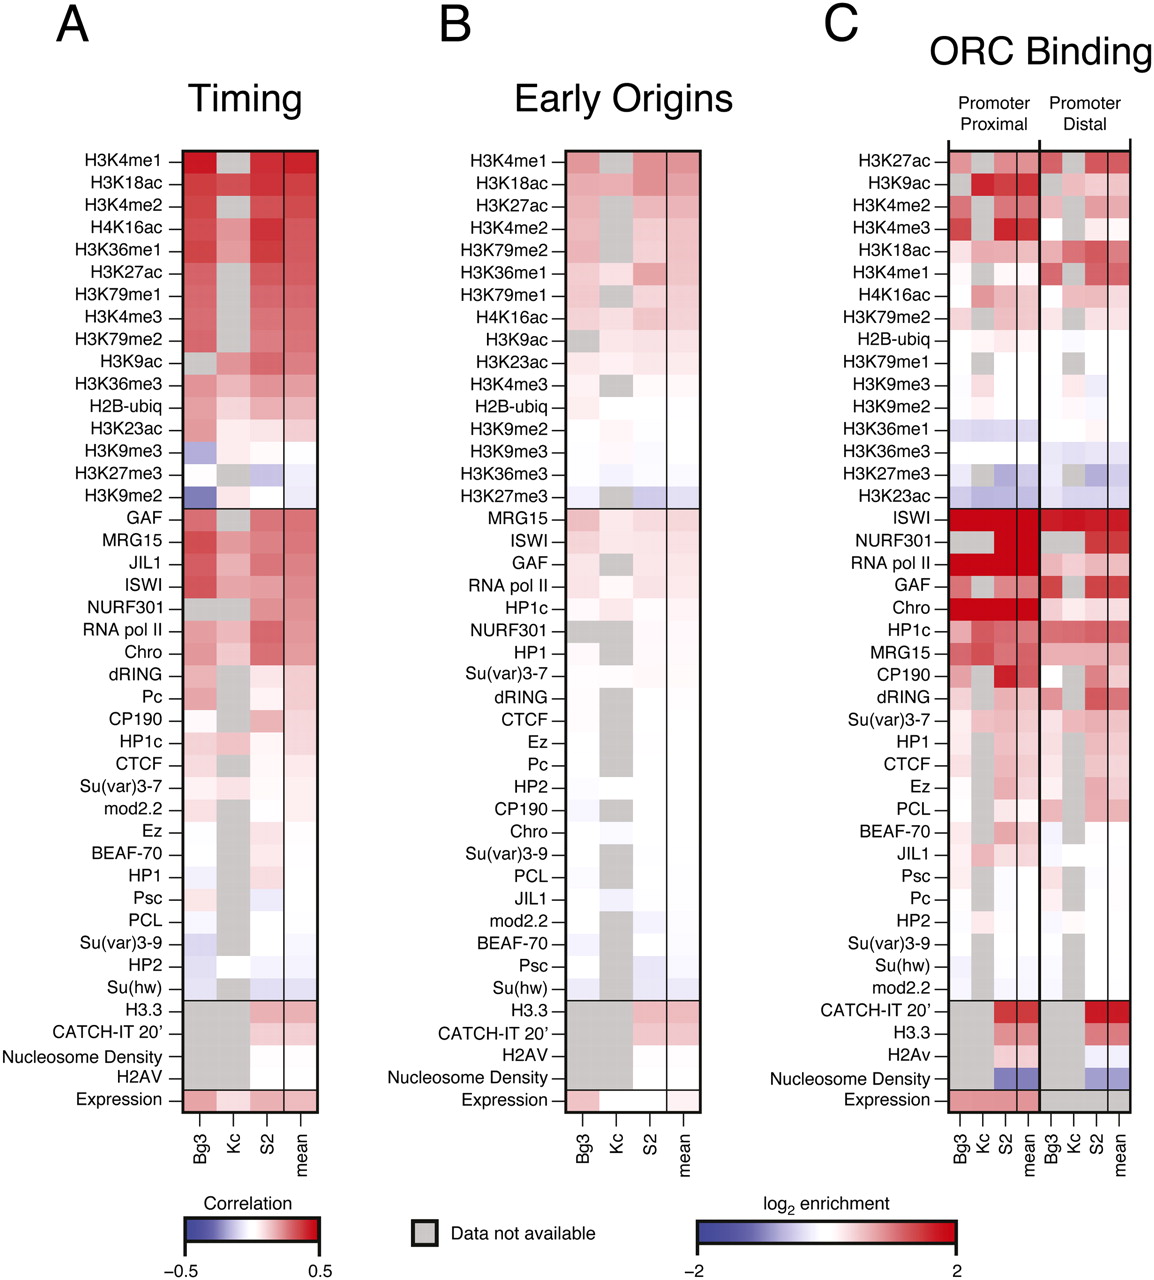
The chromatin landscape of the replication program. (A) Chromatin correlations with replication timing. The genome-wide replication timing profile of each cell line was paired with the genome-wide array scores for each chromatin factor, and the pairwise correlation of the factor with replication timing was computed (Spearman's ρ). The correlation ρ ranges from −0.5 (blue) to +.5 (red). (B) The chromatin landscape of early origins. The log2 enrichment for each factor within early origin peaks was determined for each cell line. The enrichment ranges from −2 (blue) to +2 (red). (C) The chromatin landscape of ORC-binding sites. ORC-associated sequences were divided into TSS proximal (overlapping a TSS) and TSS distal (not overlapping a TSS). The log2 enrichment for each factor within 500 bp of the ORC peak centers was determined for each cell line. The enrichment ranges from −2 (blue) to +2 (red). In all panels, gray boxes represent an experiment that has not yet been submitted to modENCODE. See Methods for details.


