
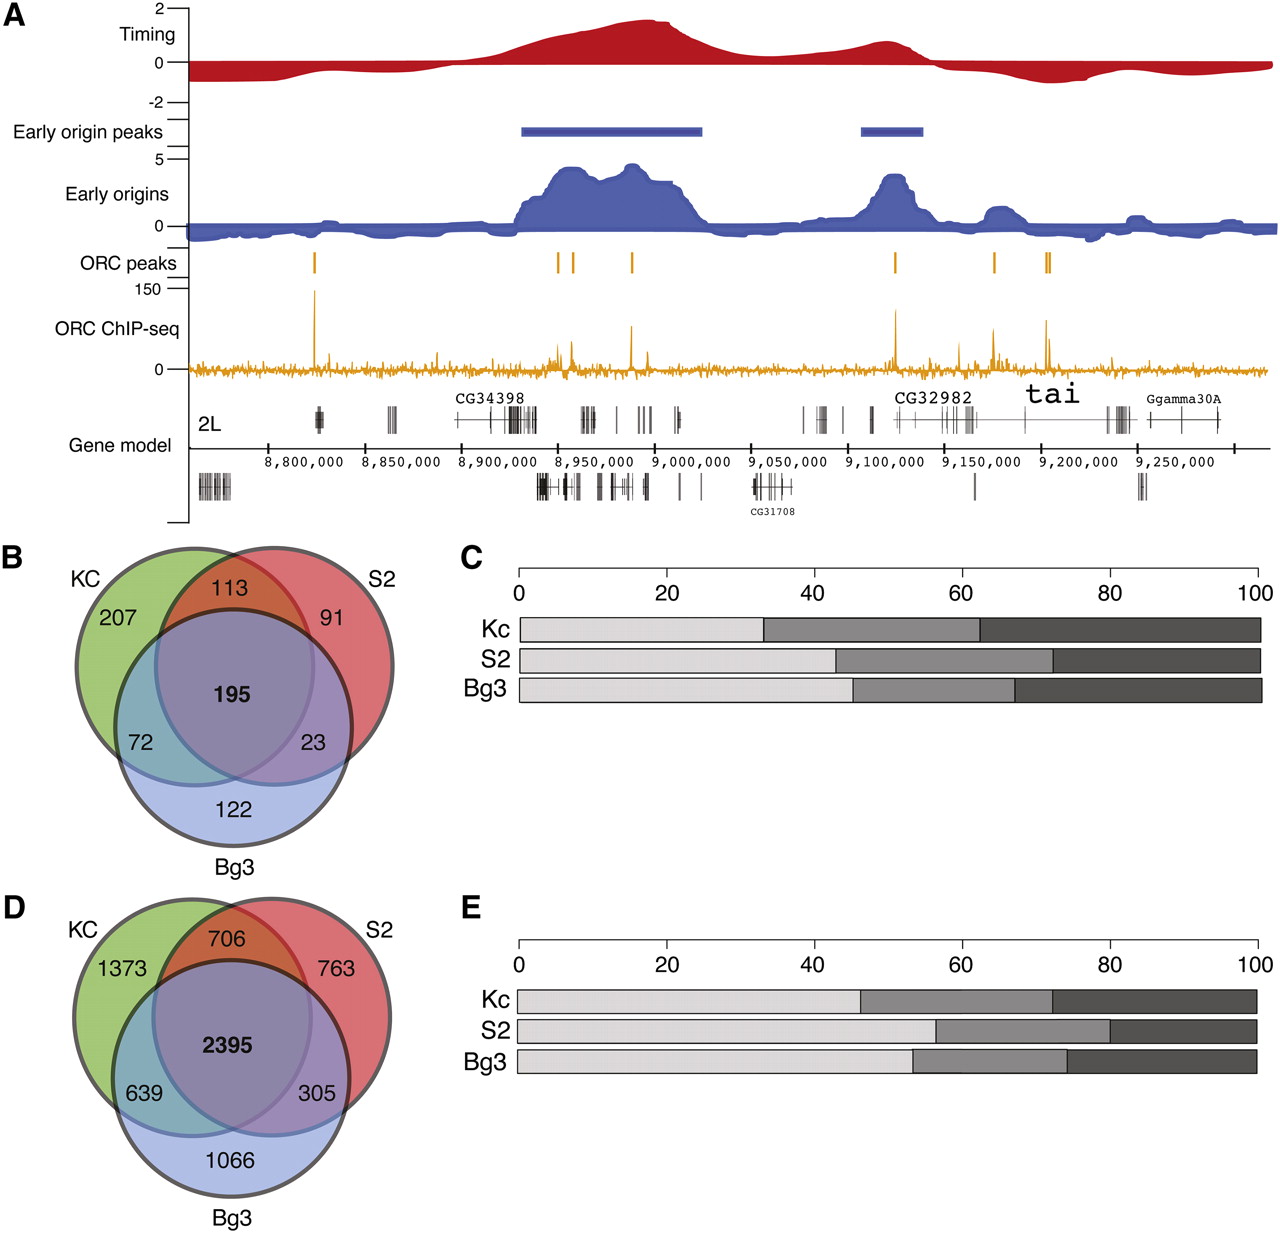
The Drosophila replication program across three cell lines. (A) Replication program in S2-DRSC cells. Genome browser track of whole-genome S-phase replication timing profiles as the log2 ratio of early to late replicating sequences (red), early origin activity as the log2 ratio of BrdU enrichment to input DNA (blue), ORC-binding sites as input corrected ChIP-seq tag depth (orange), and gene models for a 500-kb region of chromosome 2L. (B) Overlap of early origins in three cell lines. The Venn diagram shows the overlap in total early origin peaks from each cell line. (C) Distribution of early origin meta-peaks per cell line. The percentage of early origin peaks found in three cell lines (light gray), two cell lines (medium gray), or one cell line (dark gray). (D) Overlap of ORC ChIP-seq peaks in three cell lines. As in B, the Venn diagram depicts the overlap in ORC peaks for each cell line. (E) Distribution of ORC meta-peaks per cell line. Same as C for ORC ChIP-seq peaks.


