
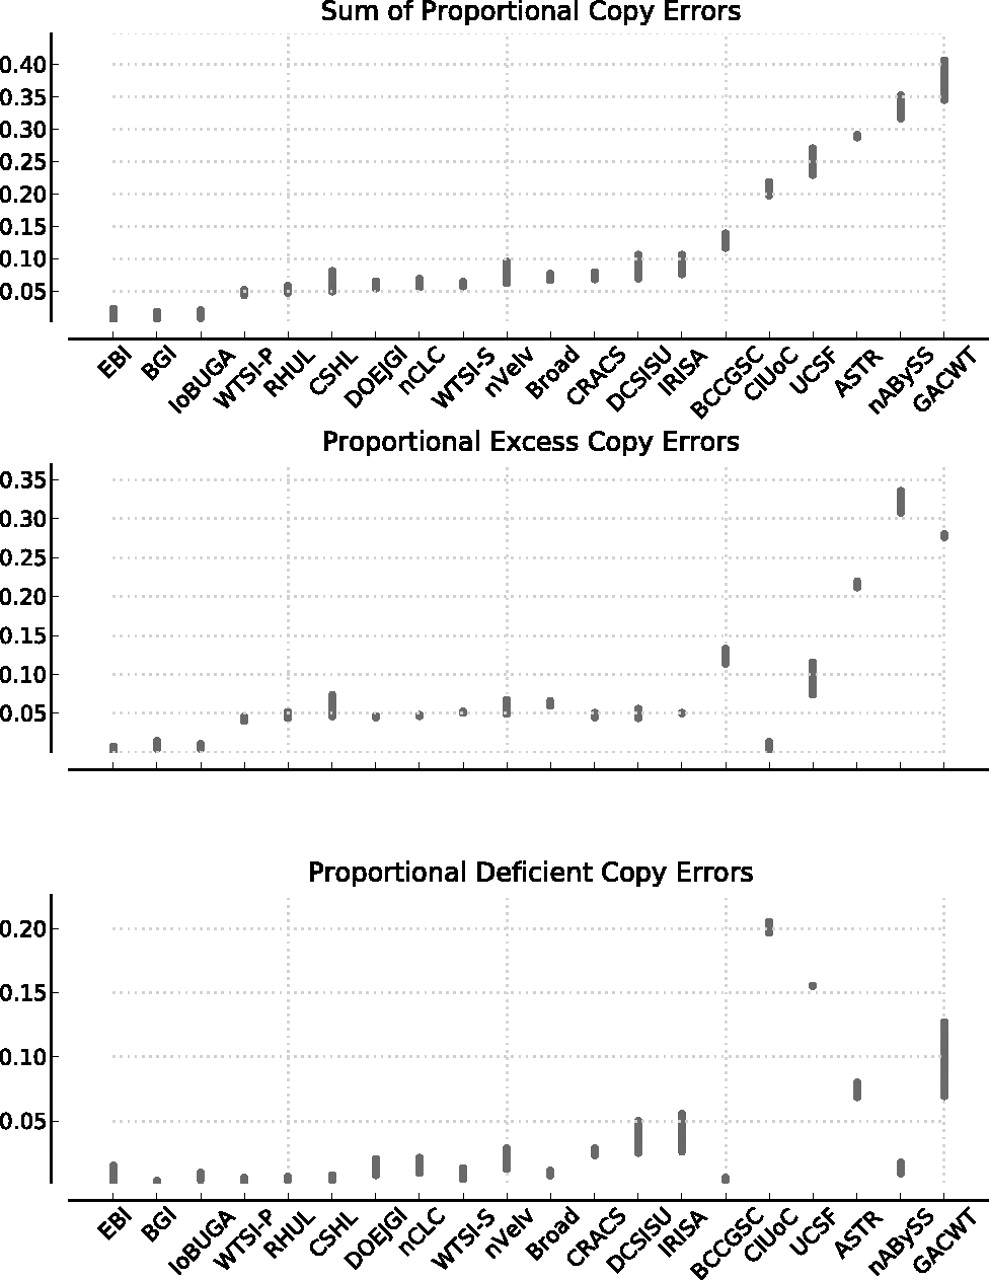
Figure 7.
Copy-number errors for the top assembly from each team. (Top) Proportion of haplotype containing columns with a copy-number error; (middle) proportion of haplotype containing columns with an excess copy-number error; (bottom) proportion of haplotype containing columns with an excess copy-number error. Assemblies are sorted from left to right in ascending order according to the proportion of haplotype containing columns with a copy-number error. In each faceted plot, each assembly is shown as an interval, giving the upper and lower bounds on the numbers of copy-number errors (see main text).


