
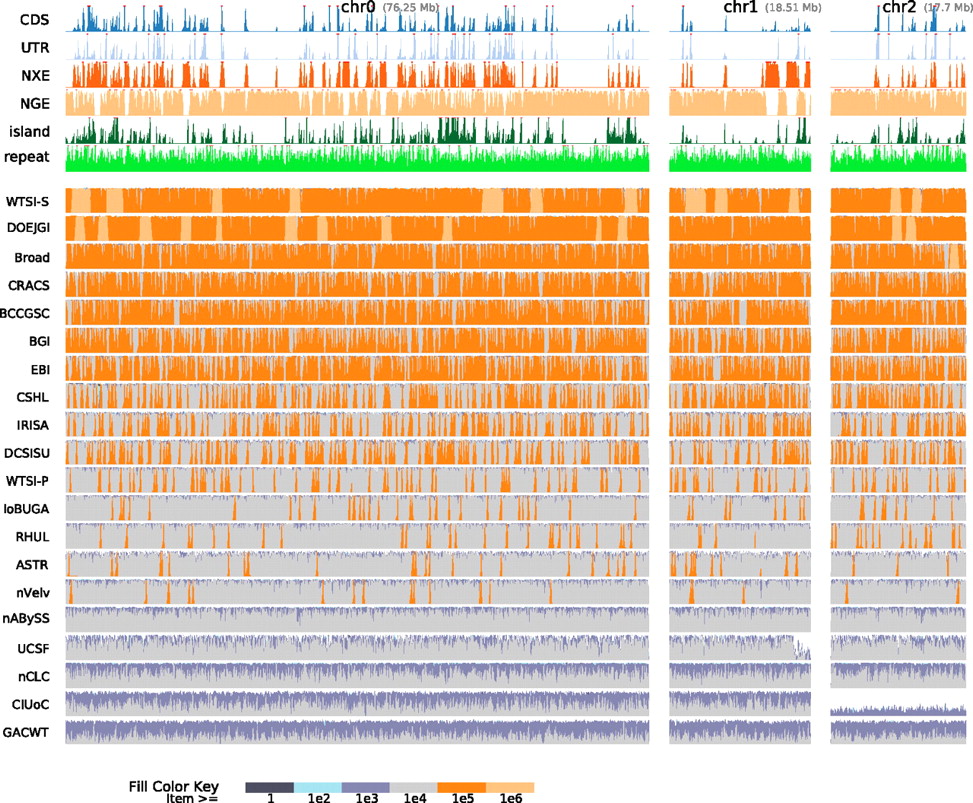
Assembly coverage along haplotype α1 stratified by scaffold path length weighted overall coverage. The top six rows show density plots of annotations. (CDS) Coding sequence; (UTR) untranslated region; (NXE) nonexonic conserved regions within genes; (NGE) nongenic conserved regions; (island) CpG islands; (repeats) repetitive elements. The remaining rows show the top-ranked assembly from each group, sorted by scaffold path length weighted overall coverage. Each such row is a density plot of the coverage, with colored stack fills used to show the length of scaffold paths mapped to a given location in the haplotype. For example, the left-most light-orange block of the WTSI-S assembly row represents a region of haplotype α1 that is almost completely covered by a scaffold path from the WTSI-S assembly greater than one megabase in length.


