
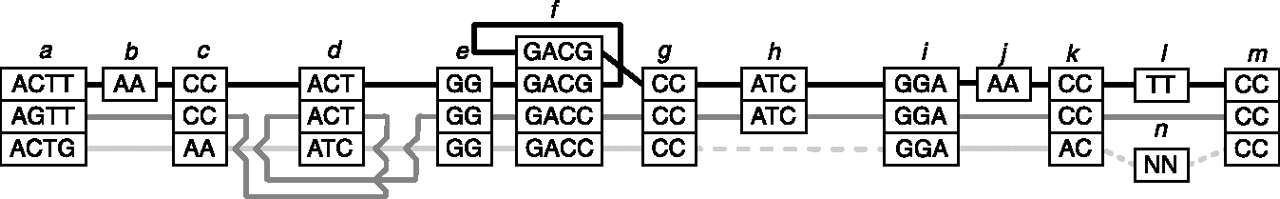
An adjacency graph example demonstrating threads, contig paths, and scaffold paths. Each stack of boxes represents a block edge. The nodes of the graph are represented by the left and right ends of the stacked boxes. The adjacency edges are groups of lines that connect the ends of the stacked boxes. Threads are represented (inset) within the graph as alternating connected boxes and colored lines. There are three threads shown: (top to bottom) black, gray, and light gray. The black and gray threads represent two haplotypes; there are many alternative haplotype threads that result from a mixture of these haplotype segments, which are equally plausible given no additional information to deconvolve them. The light-gray thread represents an assembly sequence. For the assembly thread, consistent adjacencies are shown in solid light gray. The dashed light gray line between the right end of block g and the left end of block i represents a structural error (deletion). The dashed light-gray line between the right end of block k and the left end of block m represents a scaffold gap, because the segment of the assembly in block n contains wild-card characters. The example, therefore, contains three contig paths: (from left to right) blocks a…g ACTGAAATCGGGACCCC; blocks i, j, k GGAAC; and block m CC. However, the example contains only two scaffold paths because the latter two contig paths are concatenated to form one scaffold path.


