
Figure 2.
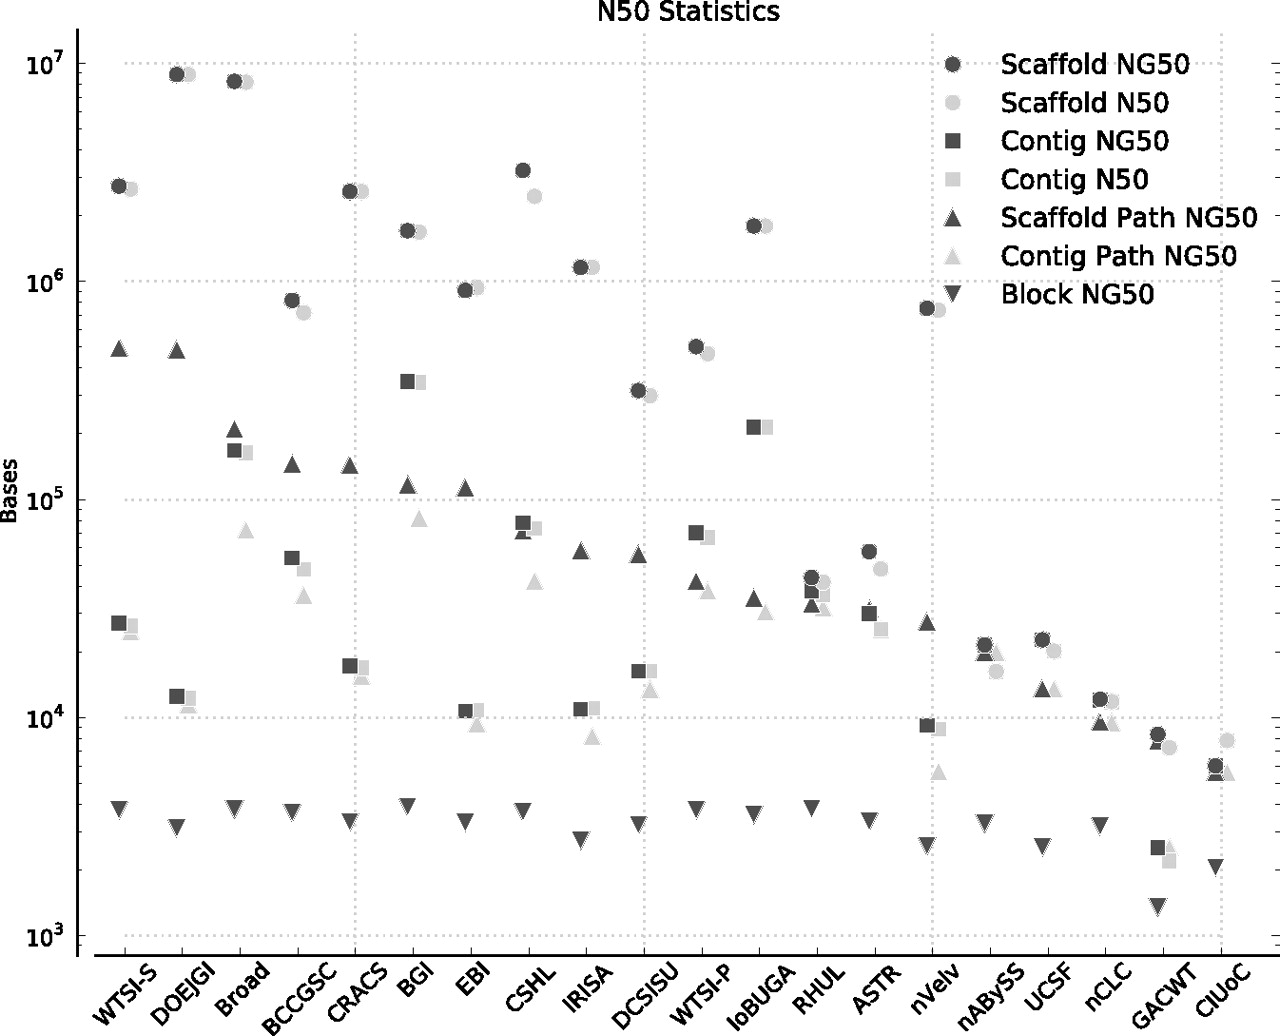
N50 statistics. Assemblies are sorted left to right in descending order by scaffold path NG50. Data points for each assembly are slightly offset along the x-axis in order to show overlaps.
(Downloading may take up to 30 seconds. If the slide opens in your browser, select File -> Save As to save it.)
Click on image to view larger version.
N50 statistics. Assemblies are sorted left to right in descending order by scaffold path NG50. Data points for each assembly are slightly offset along the x-axis in order to show overlaps.
 CiteULike
 Delicious
 Digg
Digg Facebook
 Google+
 Reddit
 Twitter
