
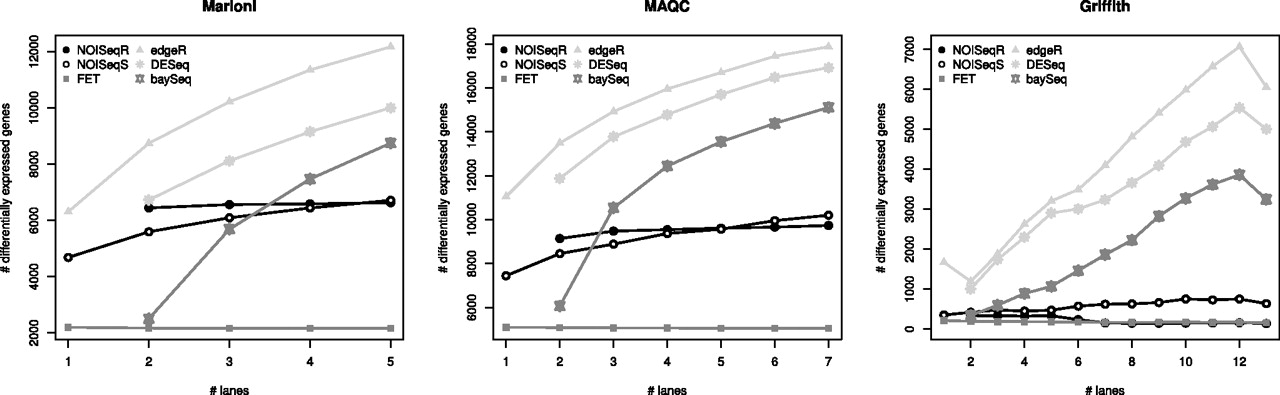
Figure 4.
Differentially expressed genes according to sequencing depth for each data set and method. No gene length correction was applied to the data.
(Downloading may take up to 30 seconds. If the slide opens in your browser, select File -> Save As to save it.)
Click on image to view larger version.
Differentially expressed genes according to sequencing depth for each data set and method. No gene length correction was applied to the data.
 CiteULike
 Delicious
 Digg
Digg Facebook
 Google+
 Reddit
 Twitter
