
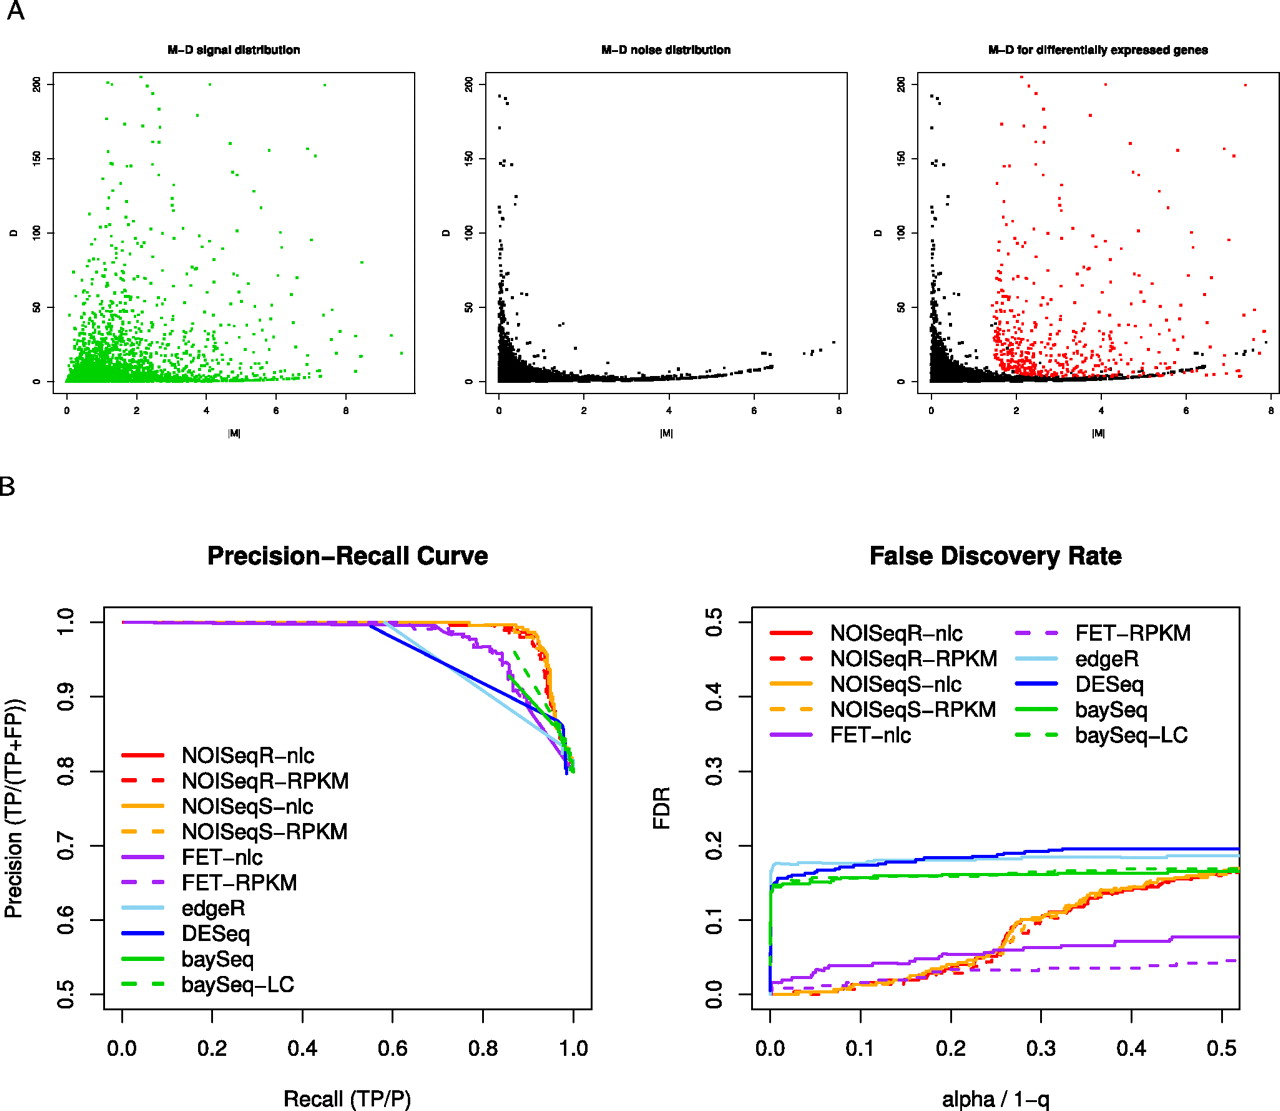
Figure 3.
NOISeq method: description and performance. (A) Schematic representation of the NOISeq methodology. M-D distribution in noise (black), signal (green), and differentially expressed genes (red). Both axis scales have been trimmed to improve visualization. (B) Precision-recall curves and false-discovery rates for the differential expression methods compared on MAQC data set using RT-PCR results as a gold-standard.


