
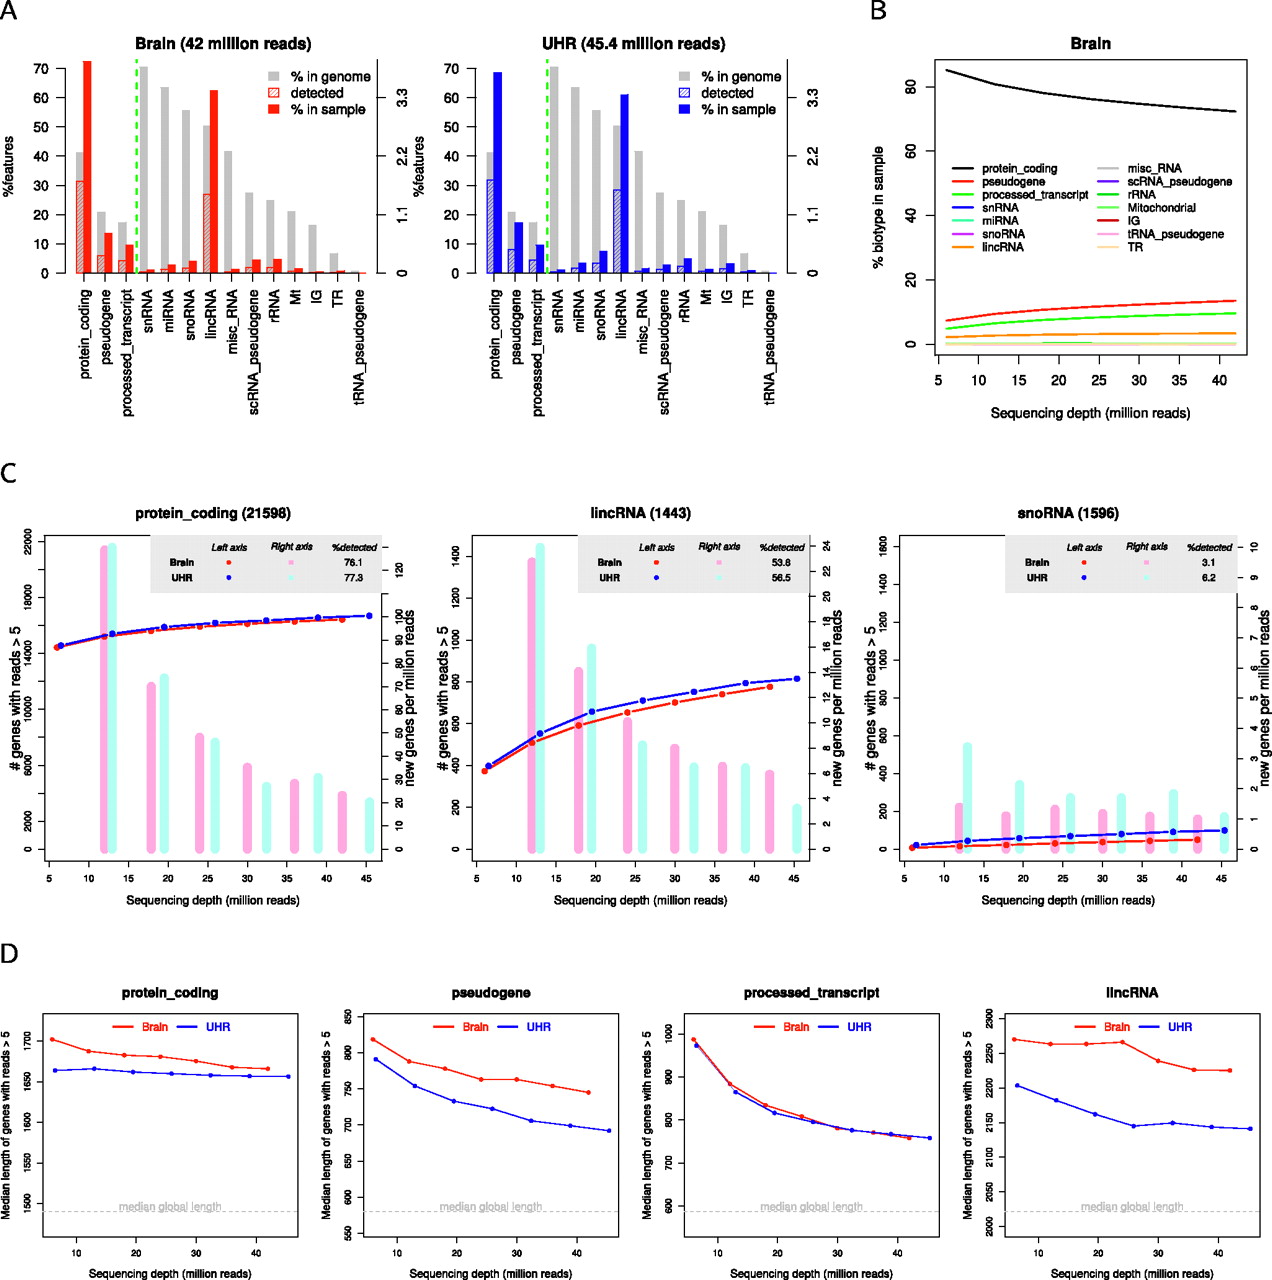
Feature detection and sequencing depth for the MAQC data. (A) Detection percentages per transcript biotype. Gray bar indicates genome percentage; striped color bar is the percentage detected by the sample with regard to the genome; and solid color bar is the percentage the biotype represents in the total detected features in the sample. Vertical line separates bars expressed in left and right y-axis scales. (B) Percentage of each transcript biotype within total detections at increasing sequencing depth (brain sample). (C) Saturation curves and NDR bars for protein-coding, lincRNA, and snoRNA. (D) Median transcript length as a function of sequencing depth for protein-coding, pseudogene, processed transcript, and lincRNA biotypes. The median global length of each biotype is computed considering genes with median transcript length >150 nucleotides.


