
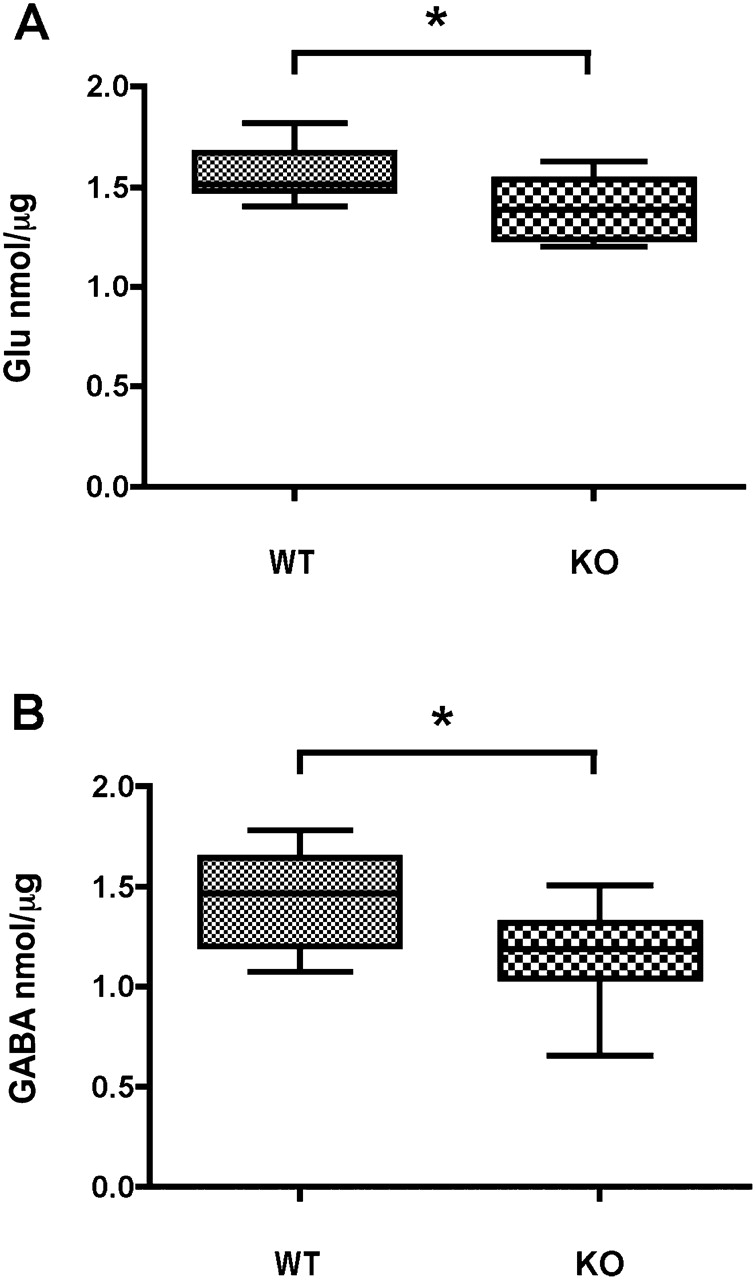
Figure 4.
Quantification of glutamate levels in cortical extracts and GABA levels in cerebellar extracts of Fmr1-KO brain vs. WT. Glutamate cortical (A) and GABA cerebellar concentrations (B) are significantly reduced in Fmr1-KO extracts compared to WT (P = 0.011; P = 0.038, respectively; n = 9 for each genotype).


