
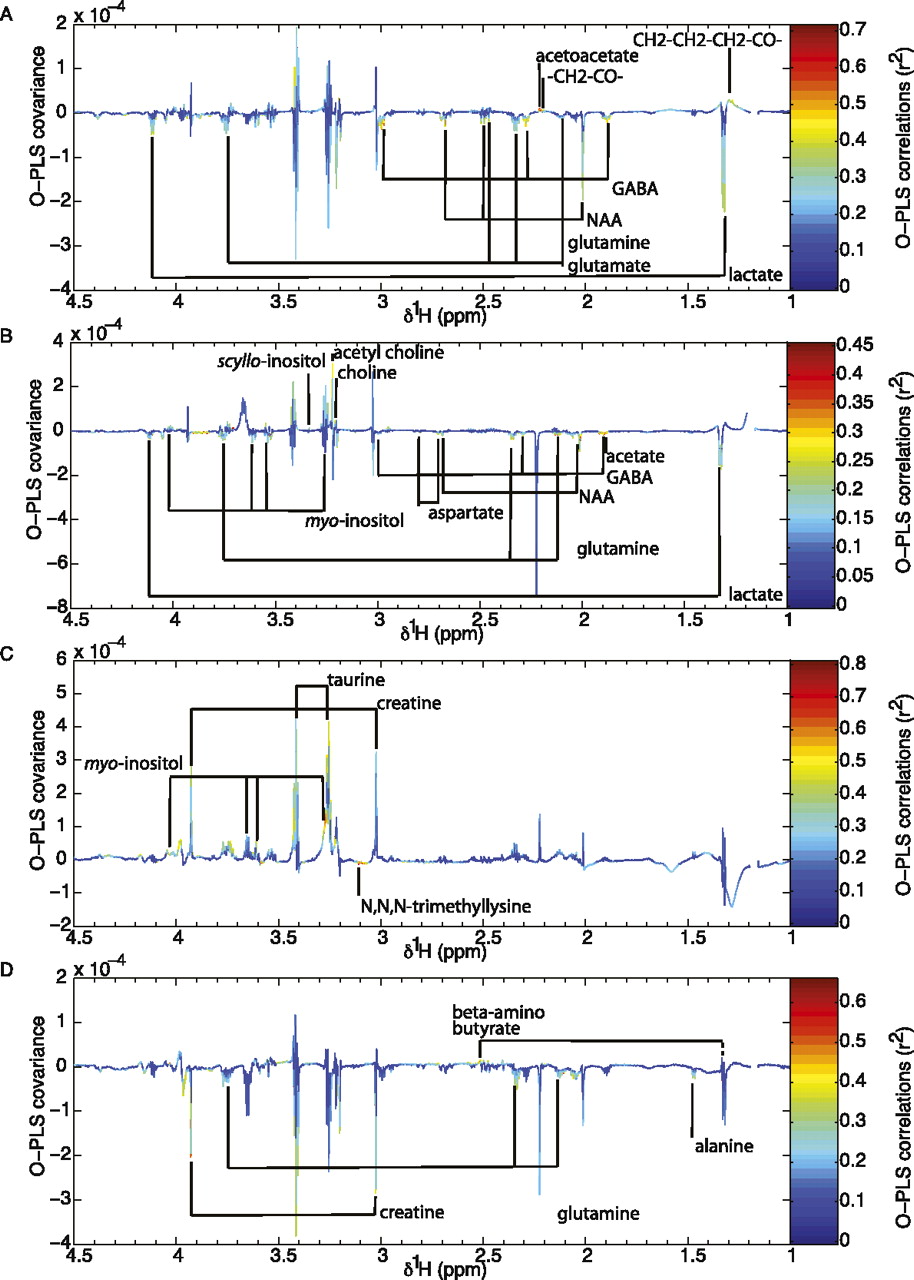
Figure 3.
Region-specific metabolic signature of Fmr1-deficiency in 12-d-old brain. Metabolic variations in 1H NMR spectra obtained from Fmr1-null and wild-type mice were assessed independently for each brain region by OPLS-DA. These OPLS-DA models are represented as a pseudo-spectrum. Positive model coefficients correspond to higher metabolite concentrations in KO animals, whereas negative model coefficients are associated with higher metabolite concentrations in WT animals. Metabolic signature as obtained from cortex (Q2Yhat = 0.61) (A), cerebellum (Q2Yhat = 0.57) (B), hippocampus (Q2Yhat = 0.84) (C), and striatum (Q2Yhat = 0.44) (D).


