
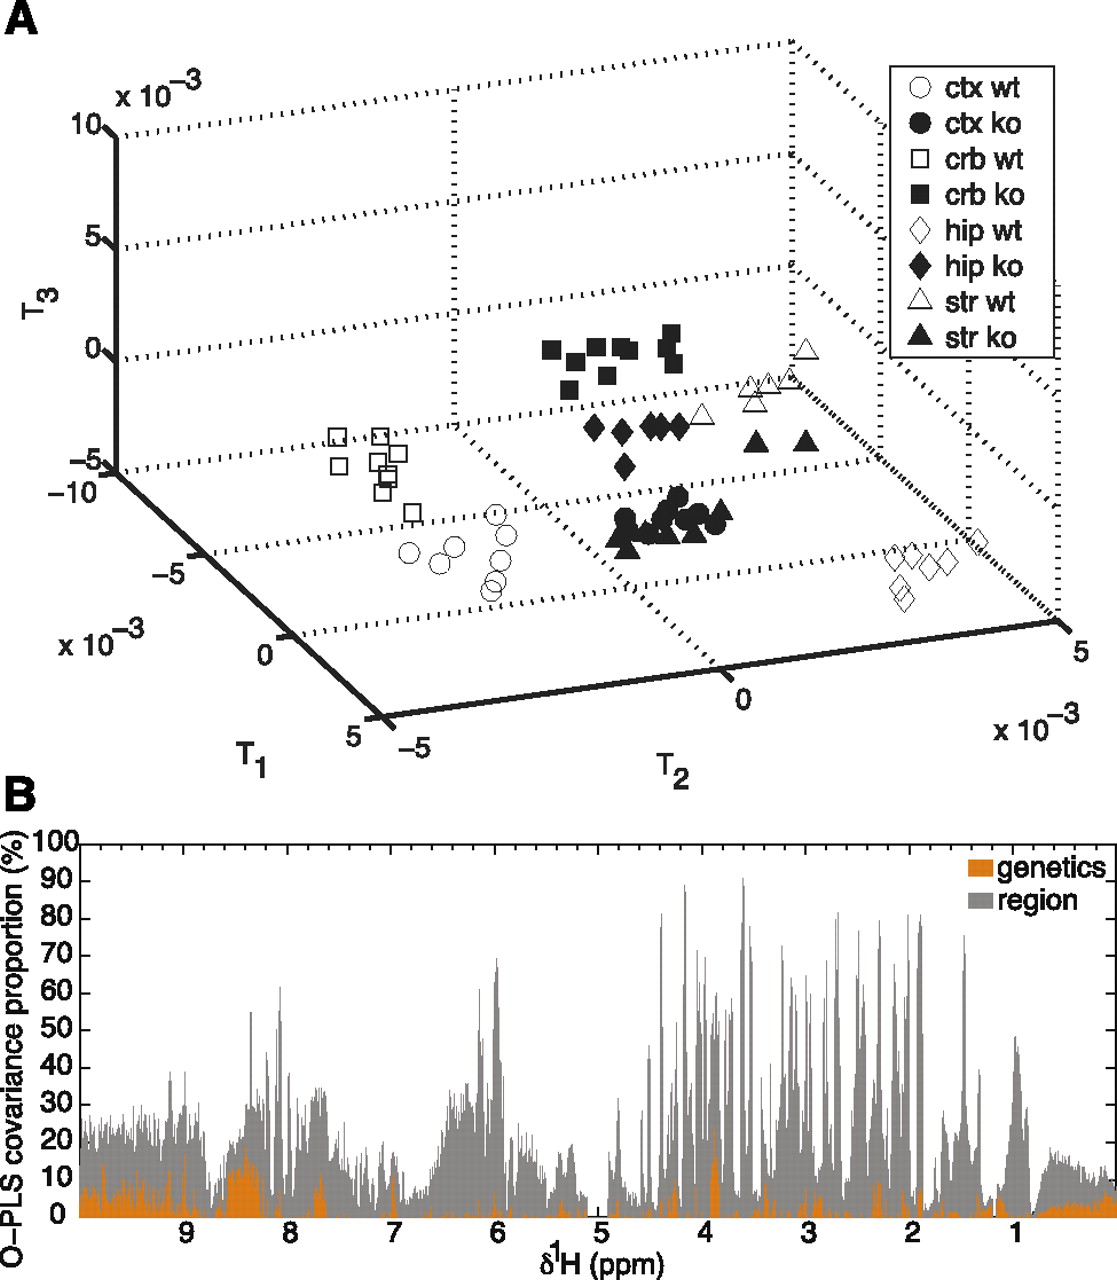
Metabolic signature of Fmr1-deficiency in 12-d-old brain. The metabolic variation observed in 1H NMR spectra acquired in 12-d-old mouse brain samples was modeled using an orthogonal partial least square-discrimination analysis (OPLS-DA). PLS components maximizing the segregation of the groups are computed. Each PLS component corresponds to a combination of the initial 1H NMR spectral variables, known as model coefficients or loadings. Each individual spectrum has new coordinates on the PLS components, known as scores. As a consequence, the three-dimensional OPLS-DA scores plot (A) segregates the different sample groups according to brain region (shapes) and Fmr1-deficiency status (white and black shapes). (B) OPLS variance component model of cortex and cerebellum. (Ctx) cortex, (crb) cerebellum, (hip) hippocampus, (str) striatum, (ko) Fmr1-knockout, (wt) wild-type samples.


