
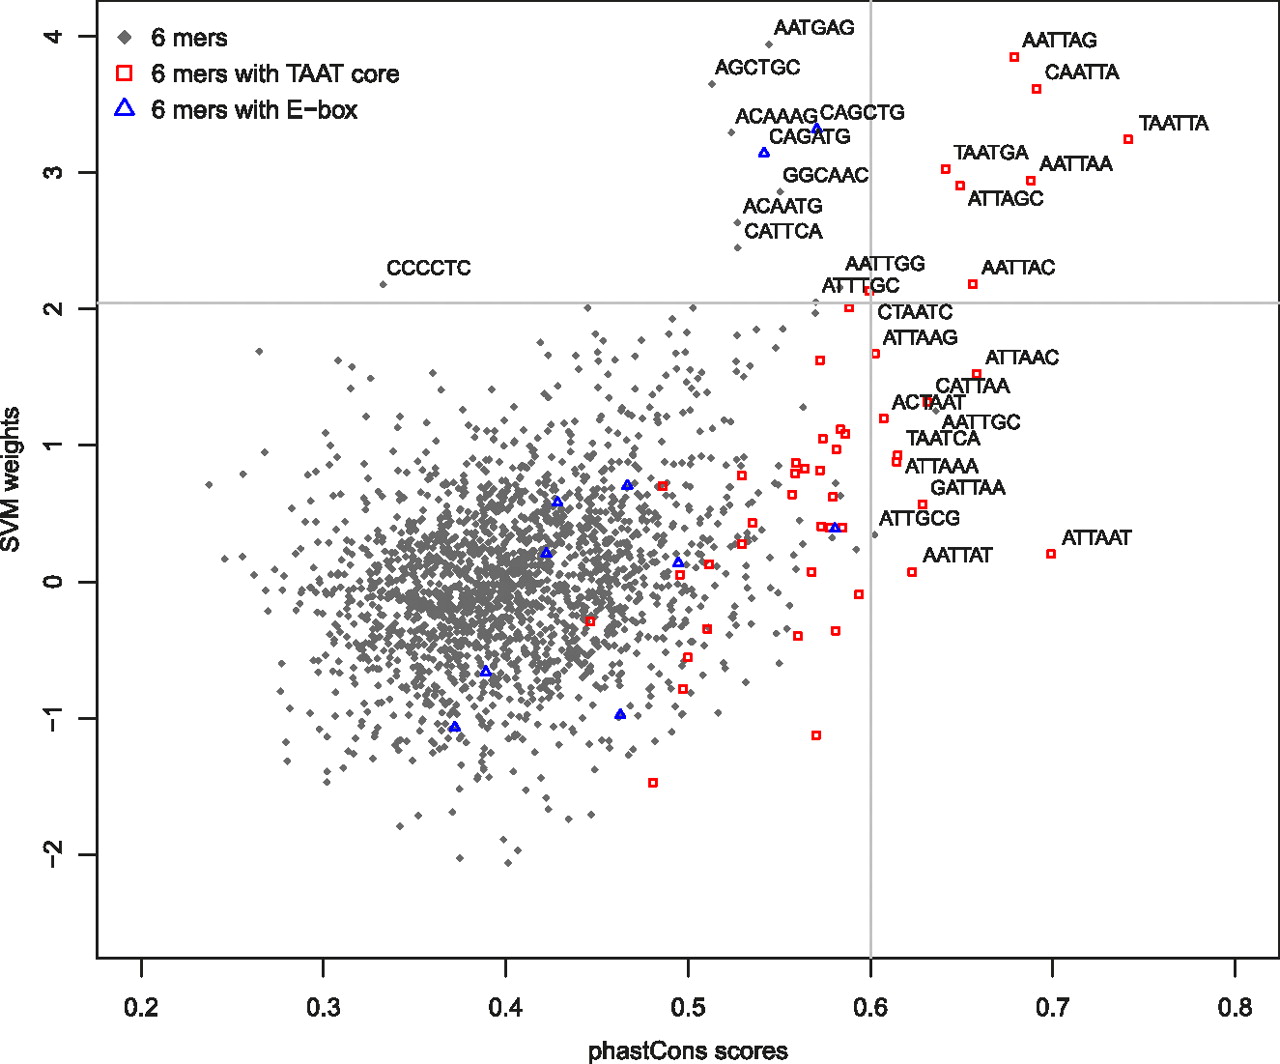
Figure 3.
Predictive SVM sequence features are more conserved. Scatter plot between SVM weights and conservation scores (phastCons scores) for 6-mers in forebrain enhancers. Two well-known TFBS, TAAT cores (red rectangles), and E-box elements (blue triangles) are highlighted. Three standard deviations above the mean (corresponding to P-value of ∼0.001) is denoted for each axis independently. The sequence of all 6-mers beyond three standard deviations above the mean is displayed.


